
Page 175 - Read Online
P. 175
Page 6 of 13 Kolba et al. Vessel Plus 2023;7:12 https://dx.doi.org/10.20517/2574-1209.2022.61
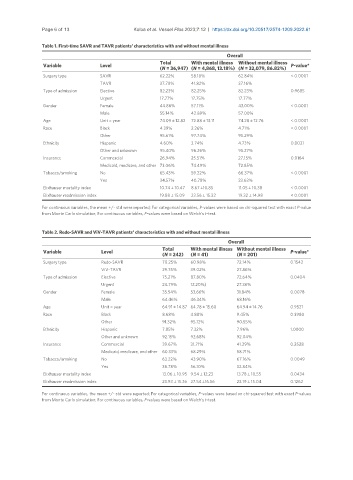
Table 1. First-time SAVR and TAVR patients’ characteristics with and without mental illness
Overall
Total With mental illness Without mental illness
Variable Level P-value*
(N = 36,947) (N = 4,868, 13.18%) (N = 32,079, 86.82%)
Surgery type SAVR 62.22% 58.18% 62.84% < 0.0001
TAVR 37.78% 41.82% 37.16%
Type of admission Elective 82.23% 82.25% 82.23% 0.9685
Urgent 17.77% 17.75% 17.77%
Gender Female 44.86% 57.11% 43.00% < 0.0001
Male 55.14% 42.89% 57.00%
Age Unit = year 74.09 ± 12.82 72.88 ± 13.11 74.28 ± 12.76 < 0.0001
Race Black 4.39% 2.26% 4.71% < 0.0001
Other 95.61% 97.74% 95.29%
Ethnicity Hispanic 4.60% 3.74% 4.73% 0.0021
Other and unknown 95.40% 96.26% 95.27%
Insurance Commercial 26.94% 25.51% 27.15% 0.0164
Medicaid, medicare, and other 73.06% 74.49% 72.85%
Tobacco/smoking No 65.43% 59.22% 66.37% < 0.0001
Yes 34.57% 40.78% 33.63%
Elixhauser mortality index 10.74 ± 10.47 8.67 ±10.85 11.05 ± 10.38 < 0.0001
Elixhauser readmission index 19.88 ± 15.09 23.56 ± 15.32 19.32 ± 14.98 < 0.0001
For continuous variables, the mean +/- std were reported; For categorical variables, P-values were based on chi-squared test with exact P-value
from Monte Carlo simulation; For continuous variables, P-values were based on Welch’s t-test.
Table 2. Redo-SAVR and ViV-TAVR patients' characteristics with and without mental illness
Overall
Variable Level Total With mental illness Without mental illness P-value*
(N = 242) (N = 41) (N = 201)
Surgery type Redo-SAVR 70.25% 60.98% 72.14% 0.1542
ViV-TAVR 29.75% 39.02% 27.86%
Type of admission Elective 75.21% 87.80% 72.64% 0.0404
Urgent 24.79% 12.20%) 27.36%
Gender Female 35.54% 53.66% 31.84% 0.0078
Male 64.46% 46.34% 68.16%
Age Unit = year 64.91 ± 14.87 64.78 ± 15.60 64.94 ± 14.76 0.9521
Race Black 8.68% 4.88% 9.45% 0.3980
Other 91.32% 95.12% 90.55%
Ethnicity Hispanic 7.85% 7.32% 7.96% 1.0000
Other and unknown 92.15% 92.68% 92.04%
Insurance Commercial 39.67% 31.71% 41.29% 0.2528
Medicaid, medicare, and other 60.33% 68.29% 58.71%
Tobacco/smoking No 63.22% 43.90% 67.16% 0.0049
Yes 36.78% 56.10% 32.84%
Elixhauser mortality index 13.06 ± 10.95 9.54 ± 12.23 13.78 ± 10.55 0.0434
Elixhauser readmission index 23.93 ± 15.36 27.54 ±16.56 23.19 ± 15.04 0.1262
For continuous variables, the mean +/- std were reported; For categorical variables, P-values were based on chi-squared test with exact P-values
from Monte Carlo simulation; For continuous variables, P-values were based on Welch’s t-test.