Page 135 - Read Online
P. 135

Novotny et al. Vessel Plus 2022;6:51  https://dx.doi.org/10.20517/2574-1209.2021.139                                        Page 5 of 15

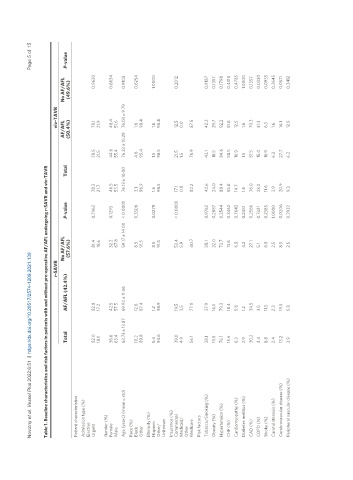
               Table 1. Baseline characteristics and risk factors in patients with and without pre-operative AF/AFL undergoing r-SAVR and viv-TAVR
                                                                     r-SAVR                                            viv-TAVR
                                                                           No AF/AFL                                AF/AFL      No AF/AFL
                                               Total      AF/AFL (42.4%)                 P-value       Total                                P-value
                                                                            (57.6%)                                 (50.4%)      (49.6%)
                Patient characteristics
                Admission type (%)
                Elective
                Urgent                         82.0       82.8                 81.4      0.7963   78.3        78.5      78.1         0.9630
                                               18.1       17.2                 18.6               21.7        21.5      21.9
                Gender (%)
                Female                         36.6       42.5                 32.2      0.1293   46.5        44.6      48.4         0.6634
                Male                           63.4       57.5                 67.8               53.5        55.4      51.6
                Age (years) (mean ± std)       63.73 ± 13.87  69.92 ± 11.06    59.17 ± 14.00 < 0.0001  76.13 ± 10.00  76.23 ± 10.29  76.03 ± 9.79  0.9103
                Race (%)
                Black                          10.2       12.6                 8.5       0.3306   3.1         4.6       1.6          0.6254
                Other                          89.8       87.4                 91.5               96.9        95.4      98.4
                Ethnicity (%)
                Hispanic                       5.4        1.2                  8.5       0.0278   1.6         1.5       1.6          1.0000
                Other/                         94.6       98.9                 91.5               98.5        98.5      98.4
                Unknown
                Insurance (%)
                Commercial                     39.0       19.5                 53.4      < 0.0001  17.1       21.5      12.5         0.2012
                Medicaid/                      4.9        3.5                  5.9                0.8         1.5       0.0
                Other
                Medicare                       56.1       77.0                 40.7               82.2        76.9      87.5
                Risk factors
                Tobacco/Smoking (%)            38.1       37.9                 38.1      0.9762   42.6        43.1      42.2         0.9187
                Obesity (%)                    19.5       16.1                 22.0      0.2887   24.0        18.5      29.7         0.1357
                Hypertension (%)               76.1       79.3                 73.7      0.3544   88.4        84.6      92.2         0.1798
                CHF (%)                        15.6       18.4                 13.6      0.3462   55.0        58.5      51.6         0.4310
                Cardiomyopathy (%)             6.3        5.8                  6.8       0.7643   14.7        16.9      12.5         0.4785
                Diabetes mellitus (%)          2.9        1.2                  4.2       0.2451   1.6         1.5       1.6          1.0000
                CAD (%)                        30.2       34.5                 27.1      0.2566   76.0        81.5      70.3         0.1357
                COPD (%)                       4.4        3.5                  5.1       0.7321   23.3        15.4      31.3         0.0330
                Stroke (%)                     8.8        11.5                 6.8       0.2385   11.6        16.9      6.3          0.0935
                Carotid stenosis (%)           2.4        2.3                  2.5       1.0000   3.9         6.2       1.6          0.3645
                Cerebrovascular disease (%)    13.2       19.5                 8.5       0.0206   20.9        27.7      14.1         0.0571
                Peripheral vascular disease (%)  3.9      5.8                  2.5       0.2932   9.3         6.2       12.5         0.2412
   130   131   132   133   134   135   136   137   138   139   140