


Page 73 - Read Online
P. 73
Page 8 of 16  Santos et al. Vessel Plus 2021;5:21  https://dx.doi.org/10.20517/2574-1209.2020.69


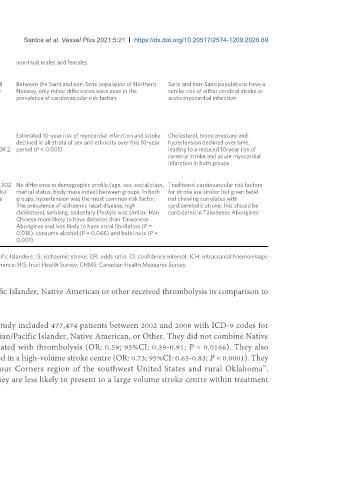
       non-Inuit males and females
 Norway
 [54]
 Siri et al.     To assess and compare   Cross-sectional   6004 participants; 5318   Between the Sami and non-Sami population of Northern   Sami and non-Sami populations have a
 (2018)  cardiovascular risk factors and   population-based survey;  included (40.8% Sami)  Norway, only minor differences were seen in the   similar risk of either cerebral stroke or
 the 10-year risk of myocardial   2012-2014  prevalence of cardiovascular risk factors  acute myocardial infarction
 infarction or stroke (using
 [56]
 NORRISK2 model)   among
 Sami and non-Sami populations
 of Northern Norway
 [38]
 Siri et al.   (2019) To describe the changes in   Cross-sectional surveys -  6417 participants in   Estimated 10-year risk of myocardial infarction and stroke   Cholesterol, blood pressure and
 [55]
 cardiovascular risk factor profile   SAMINOR 1  ; 2003-  SAMINOR 1, 5956   declined in all strata of sex and ethnicity over this 10-year   hypertension declined over time,
 [54]
 and risk of myocardial infarction   2004, SAMINOR 2  ;   participants in SAMINOR 2 period (P < 0.001)  leading to a reduced 10-year risk of
 or stroke amongst the Sami and   2012-2014               cerebral stroke and acute myocardial
 non-Sami population                                      infarction in both groups
 Taiwan
 [57]
 Hung et al.     Comparison of demographic   Prospective cohort study;  433 patients identified, 302  No difference in demographic profile (age, sex, social class,  Traditional cardiovascular risk factors
 (2016)  details, conventional and   single centre; 2007-2009 were Han Chinese (70%)   marital status, body mass index) between groups. In both   for stroke are similar but given betel
 behavioural risk factors between   and 131 were Taiwanese   groups, hypertension was the most common risk factor.   nut chewing correlates with
 Taiwanese Aborigines and Han   Aborigines (30%)  The prevalence of ischaemic heart disease, high   cardioembolic stroke; this should be
 Chinese patients with stroke  cholesterol, smoking, sedentary lifestyle was similar. Han   considered in Taiwanese Aborigines
       Chinese more likely to have diabetes than Taiwanese
       Aborigines and less likely to have atrial fibrillation (P =
       0.018), consume alcohol (P = 0.046) and betel nuts (P =
       0.001)


 CVD: Cardiovascular disease; NH: Native Hawaiians; PI: Pacific Islanders; NHPI: Native Hawaiian and Pacific Islanders; IS: ischaemic stroke; OR: odds ratio; CI: confidence interval; ICH: intracranial haemorrhage;
 HTN: hypertension; IA: Indigenous Africans; AA: African Americans; EA: European Americans; RD: risk difference; HIS: Inuit Health Survey; CHMS: Canadian Health Measures Survey.


 primary stroke centre 0.75 (CI: 0.62-0.88), showing that 25% fewer Asian/Pacific Islander, Native American or other received thrombolysis in comparison to
 Whites.


 In 2014 Kimball et al.  also analysed the NIS database. Their retrospective study included 477,474 patients between 2002 and 2008 with ICD-9 codes for
 [64]
 ischemic stroke. Race was classified as White, African American, Hispanic, Asian/Pacific Islander, Native American, or Other. They did not combine Native
 American with Other. They determined that race was independently associated with thrombolysis (OR: 0.59; 95%CI: 0.39-0.91; P = 0.0166). They also
 determined that, relative to Whites, Native Americans were unlikely to be treated in a high-volume stroke centre (OR: 0.73; 95%CI: 0.65-0.83; P < 0.0001). They
 comment that Native Americans are more likely to live in the remote “Four Corners region of the southwest United States and rural Oklahoma”.

 Consequently, these patients are then less likely to receive thrombolysis as they are less likely to present to a large volume stroke centre within treatment
 windows.

