


Page 68 - Read Online
P. 68
Page 6 of 16                                                                                      Santos et al. Vessel Plus 2021;5:21  https://dx.doi.org/10.20517/2574-1209.2020.69


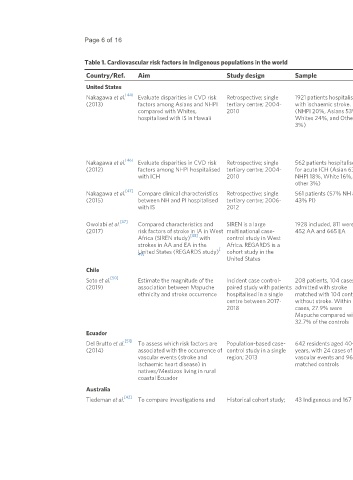
                              Table 1. Cardiovascular risk factors in Indigenous populations in the world

                              Country/Ref.      Aim                          Study design           Sample                    Results                                            Conclusions

                              United States
                                           [44]
                              Nakagawa et al.    Evaluate disparities in CVD risk   Retrospective; single   1921 patients hospitalised   NHPI were more likely to be younger (OR: 0.95, 95%CI:   Disparities could be attributable to
                              (2013)            factors among Asians and NHPI   tertiary centre; 2004-  with ischaemic stroke.   0.94-0.96), female (OR: 1.55, 95%CI: 1.07-2.24), and have  biological and social determinants of
                                                compared with Whites,        2010                   (NHPI 20%, Asians 53%,    diabetes (OR: 2.74, 95%CI: 1.87-4.00), hypertension (OR:  disease
                                                hospitalised with IS in Hawaii                      Whites 24%, and Others    1.98, 95%CI: 1.27-3.10), and obesity (OR: 1.82, 95%CI:
                                                                                                    3%)                       1.25-2.65) than Whites. Compared with Asians, NHPI were
                                                                                                                              more likely to be younger (OR: 0.95, 95%CI: 0.94-0.97)
                                                                                                                              and have diabetes (OR: 1.88, 95%CI: 1.35-2.61), previous
                                                                                                                              stroke or TIA (OR: 1.57, 95%CI: 1.09-2.25), and obesity
                                                                                                                              (OR: 6.05, 95%CI: 4.31-8.48)
                                           [46]
                              Nakagawa et al.    Evaluate disparities in CVD risk   Retrospective; single   562 patients hospitalised   NHPI were younger (NHPI 55 years vs. White 66 years, P <  NHPI with ICH are younger and have a
                              (2012)            factors among NHPI hospitalised  tertiary centre; 2004-  for acute ICH (Asian 63%,   0.0001), and had higher prevalence of diabetes (NHPI 35%  greater burden of risk factors
                                                with ICH                     2010                   NHPI 18%, White 16%,      vs. White 20%, P = 0.01) and history of HTN (NHPI 77%   compared to White patients
                                                                                                    other 3%)                 vs. White 64%, P = 0.04) than White patients
                                           [47]
                              Nakagawa et al.    Compare clinical characteristics   Retrospective; single   561 patients (57% NH and   PI were younger (59 years vs. 62 years, P = 0.002), higher  Whilst differences were seen, they
                              (2015)            between NH and PI hospitalised   tertiary centre; 2006-  43% PI)              prevalence of diabetes mellitus (58% vs. 41%, P < 0. 0001)  were not as significant as seen in other
                                                with IS                      2012                                             and lower prevalence of smoking (14% vs. 21%, P = 0.03)   studies comparing Native Hawaiians to
                                                                                                                              compared to NH                                     a non-Hispanic population
                                          [37]
                              Owolabi et al.     Compared characteristics and   SIREN is a large    1928 included, 811 were IA,  IA were younger (68) compared with AA (73) and even   They concluded that race played a
                              (2017)            risk factors of stroke in IA in West  multinational case-  452 AA and 665 EA  younger than EA (76) P < 0.0001. IA were much more   major role in the predisposition of
                                                                 [48]
                                                Africa (SIREN study)   with   control study in West                           likely to have haemorrhagic strokes than EA (IA 27%, AA   vascular risk factors whilst
                                                strokes in AA and EA in the   Africa. REGARDS is a                            8%, EA 5.4%, P < 0.001). IA and AA had a greater   geographical location potentially
                                                                           [
                                                United States (REGARDS study)  cohort study in the                            prevalence of hypertension, high cholesterol and diabetes   influenced stroke type
                                                49]
                                                                             United States                                    mellitus
                              Chile
                                      [50]
                              Soto et al.       Estimate the magnitude of the   Incident case control-  208 patients, 104 cases   No detectable difference in the association between   Risk factors for stroke included obesity,
                              (2019)            association between Mapuche   paired study with patients  admitted with stroke   Mapuche ethnicity and stroke (OR: 0.84, 95%CI: 0.46-1.51,  hypertension and smoking, but
                                                ethnicity and stroke occurrence  hospitalised in a single   matched with 104 controls  P = 0.55). Ethnicity was not a factor associated with stroke  Mapuche ethnicity was not a risk
                                                                             centre between 2017-   without stroke. Within the   when adjusted for hypertension, obesity, low    factor
                                                                             2018                   cases, 27.9% were         socioeconomic status, rurality, diabetes mellitus and
                                                                                                    Mapuche compared with     smoking
                                                                                                    32.7% of the controls
                              Ecuador
                                           [51]
                              Del Brutto et al.    To assess which risk factors are   Population-based case-  642 residents aged 40+   The only difference detected in the cardiovascular risk   The authors concluded that none of
                              (2014)            associated with the occurrence of  control study in a single   years, with 24 cases of   factor profile was that cases undertook less physical   the measured risk factors were
                                                vascular events (stroke and   region; 2013          vascular events and 96    activity than controls (OR: 2.8, 95%CI: 1.2-4.3, P < 0.0001) associated with the occurrence of
                                                ischaemic heart disease) in                         matched controls                                                             vascular events
                                                natives/Mestizos living in rural
                                                coastal Ecuador
                              Australia
                                           [42]
                              Tiedeman et al.    To compare investigations and   Historical cohort study;   43 Indigenous and 167 non- Compared to non-Indigenous patients with stroke,   Indigenous patients within rural NSW

