


Page 51 - Read Online
P. 51
Page 4 of 10                                                   Inoue et al. Vessel Plus 2021;5:11  I  http://dx.doi.org/10.20517/2574-1209.2020.99


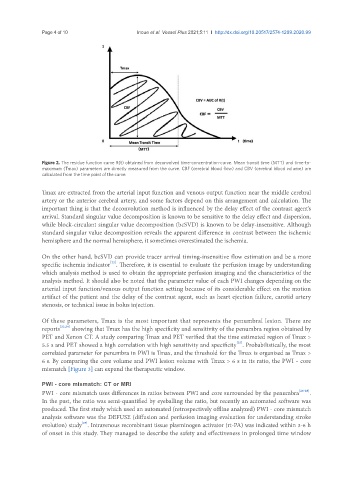
               Figure 2. The residue function curve R(t) obtained from deconvolved time-concentration-curve. Mean transit time (MTT) and time-to-
               maximum (Tmax) parameters are directly measured from the curve. CBF (cerebral blood flow) and CBV (cerebral blood volume) are
               calculated from the time point of the curve.

               Tmax are extracted from the arterial input function and venous output function near the middle cerebral
               artery or the anterior cerebral artery, and some factors depend on this arrangement and calculation. The
               important thing is that the deconvolution method is influenced by the delay effect of the contrast agent’s
               arrival. Standard singular value decomposition is known to be sensitive to the delay effect and dispersion,
               while block-circulant singular value decomposition (bcSVD) is known to be delay-insensitive. Although
               standard singular value decomposition reveals the apparent difference in contrast between the ischemic
               hemisphere and the normal hemisphere, it sometimes overestimated the ischemia.

               On the other hand, bcSVD can provide tracer arrival timing-insensitive flow estimation and be a more
                                      [22]
               specific ischemia indicator . Therefore, it is essential to evaluate the perfusion image by understanding
               which analysis method is used to obtain the appropriate perfusion imaging and the characteristics of the
               analysis method. It should also be noted that the parameter value of each PWI changes depending on the
               arterial input function/venous output function setting because of its considerable effect on the motion
               artifact of the patient and the delay of the contrast agent, such as heart ejection failure, carotid artery
               stenosis, or technical issue in bolus injection.

               Of these parameters, Tmax is the most important that represents the penumbral lesion. There are
               reports [23,24]  showing that Tmax has the high specificity and sensitivity of the penumbra region obtained by
               PET and Xenon CT. A study comparing Tmax and PET verified that the time estimated region of Tmax >
                                                                                 [25]
               5.5 s and PET showed a high correlation with high sensitivity and specificity . Probabilistically, the most
               correlated parameter for penumbra in PWI is Tmax, and the threshold for the Tmax is organized as Tmax >
               6 s. By comparing the core volume and PWI lesion volume with Tmax > 6 s in its ratio, the PWI - core
               mismatch [Figure 3] can expand the therapeutic window.


               PWI - core mismatch: CT or MRI
               PWI - core mismatch uses differences in ratios between PWI and core surrounded by the penumbra [26-28] .
               In the past, the ratio was semi-quantified by eyeballing the ratio, but recently an automated software was
               produced. The first study which used an automated (retrospectively offline analyzed) PWI - core mismatch
               analysis software was the DEFUSE (diffusion and perfusion imaging evaluation for understanding stroke
                             [29]
               evolution) study . Intravenous recombinant tissue plasminogen activator (rt-PA) was indicated within 3-6 h
               of onset in this study. They managed to describe the safety and effectiveness in prolonged time window

