


Page 50 - Read Online
P. 50
Inoue et al. Vessel Plus 2021;5:11  I  http://dx.doi.org/10.20517/2574-1209.2020.99                                                Page 3 of 10


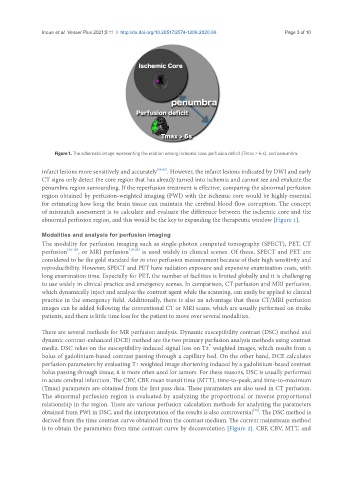
                    Figure 1. The schematic image representing the relation among ischemic core, perfusion deficit (Tmax > 6 s), and penumbra.

               infarct lesions more sensitively and accurately [14,15] . However, the infarct lesions indicated by DWI and early
               CT signs only detect the core region that has already turned into ischemia and cannot see and evaluate the
               penumbra region surrounding. If the reperfusion treatment is effective, comparing the abnormal perfusion
               region obtained by perfusion-weighted imaging (PWI) with the ischemic core would be highly essential
               for estimating how long the brain tissue can maintain the cerebral blood flow corruption. The concept
               of mismatch assessment is to calculate and evaluate the difference between the ischemic core and the
               abnormal perfusion region, and this would be the key to expanding the therapeutic window [Figure 1].

               Modalities and analysis for perfusion imaging
               The modality for perfusion imaging such as single-photon computed tomography (SPECT), PET, CT
               perfusion [16-18] , or MRI perfusion [19-21]  is used widely in clinical scenes. Of these, SPECT and PET are
               considered to be the gold standard for in vivo perfusion measurement because of their high sensitivity and
               reproducibility. However, SPECT and PET have radiation exposure and expensive examination costs, with
               long examination time. Especially for PET, the number of facilities is limited globally and it is challenging
               to use widely in clinical practice and emergency scenes. In comparison, CT perfusion and MRI perfusion,
               which dynamically inject and analyze the contrast agent while the scanning, can easily be applied to clinical
               practice in the emergency field. Additionally, there is also an advantage that these CT/MRI perfusion
               images can be added following the conventional CT or MRI scans, which are usually performed on stroke
               patients, and there is little time loss for the patient to move over several modalities.


               There are several methods for MR perfusion analysis. Dynamic susceptibility contrast (DSC) method and
               dynamic contrast-enhanced (DCE) method are the two primary perfusion analysis methods using contrast
                                                                       *
               media. DSC relies on the susceptibility-induced signal loss on T2  weighted images, which results from a
               bolus of gadolinium-based contrast passing through a capillary bed. On the other hand, DCE calculates
               perfusion parameters by evaluating T1 weighted image shortening induced by a gadolinium-based contrast
               bolus passing through tissue; it is more often used for tumors. For these reasons, DSC is usually performed
               in acute cerebral infarction. The CBV, CBF, mean transit time (MTT), time-to-peak, and time-to-maximum
               (Tmax) parameters are obtained from the first pass data. These parameters are also used in CT perfusion.
               The abnormal perfusion region is evaluated by analyzing the proportional or inverse proportional
               relationship in the region. There are various perfusion calculation methods for analyzing the parameters
               obtained from PWI in DSC, and the interpretation of the results is also controversial . The DSC method is
                                                                                      [22]
               derived from the time contrast curve obtained from the contrast medium. The current mainstream method
               is to obtain the parameters from time contrast curve by deconvolution [Figure 2]. CBF, CBV, MTT, and

