


Page 115 - Read Online
P. 115
Edwards et al. Vessel Plus 2021;5:42  https://dx.doi.org/10.20517/2574-1209.2021.18  Page 5 of 14


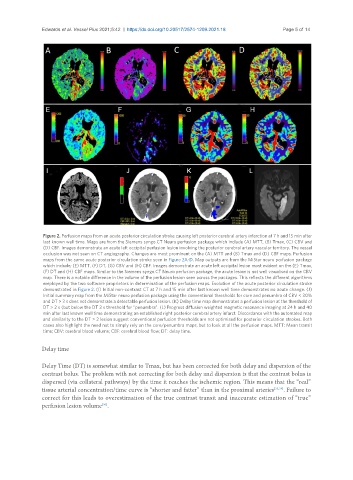
                Figure 2. Perfusion maps from an acute posterior circulation stroke causing left posterior cerebral artery infarction at 7 h and 15 min after
                last known well time. Maps are from the Siemens syngo.CT Neuro perfusion package which include (A) MTT, (B) Tmax, (C) CBV and
                (D) CBF. Images demonstrate an acute left occipital perfusion lesion involving the posterior cerebral artery vascular territory. The vessel
                occlusion was not seen on CT angiography. Changes are most prominent on the (A) MTT and (B) Tmax and (D) CBF maps. Perfusion
                maps from the same acute posterior circulation stroke seen in Figure 2A-D. Map outputs are from the MiStar neuro perfusion package
                which include; (E) MTT, (F) DT, (G) CBV and (H) CBF. Images demonstrate an acute left occipital lesion most evident on the (E) Tmax,
                (F) DT and (H) CBF maps. Similar to the Siemens syngo.CT Neuro perfusion package, the acute lesion is not well visualised on the CBV
                map. There is a notable difference in the volume of the perfusion lesion seen across the packages. This reflects the different algorithms
                employed by the two software proprietors in determination of the perfusion maps. Evolution of the acute posterior circulation stroke
                demonstrated in Figure 2. (I) Initial non-contrast CT at 7 h and 15 min after last known well time demonstrates no acute change. (J)
                Initial summary map from the MiStar neuro perfusion package using the conventional thresholds for core and penumbra of CBV < 30%
                and DT > 3 s does not demonstrate a detectable perfusion lesion. (K) Delay time map demonstrates a perfusion lesion at the threshold of
                DT > 2 s (but below the DT 3 s threshold for “penumbra”. (L) Progress diffusion weighted magnetic resonance imaging at 24 h and 40
                min after last known well time demonstrating an established right posterior cerebral artery infarct. Discordance with the automated map
                and similarity to the DT > 2 lesion suggest conventional perfusion thresholds are not optimised for posterior circulation strokes. Both
                cases also highlight the need not to simply rely on the core/penumbra maps, but to look at all the perfusion maps. MTT: Mean transit
                time; CBV: cerebral blood volume; CBF: cerebral blood flow; DT: delay time.


               Delay time

               Delay Time (DT) is somewhat similar to Tmax, but has been corrected for both delay and dispersion of the
               contrast bolus. The problem with not correcting for both delay and dispersion is that the contrast bolus is
               dispersed (via collateral pathways) by the time it reaches the ischemic region. This means that the “real”
               tissue arterial concentration/time curve is “shorter and fatter” than in the proximal arteries [33,34] . Failure to
               correct for this leads to overestimation of the true contrast transit and inaccurate estimation of “true”
               perfusion lesion volume .
                                   [30]

