


Page 114 - Read Online
P. 114
Page 4 of 14                 Edwards et al. Vessel Plus 2021;5:42  https://dx.doi.org/10.20517/2574-1209.2021.18


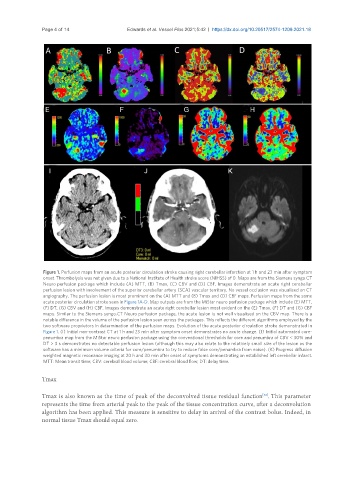
                Figure 1. Perfusion maps from an acute posterior circulation stroke causing right cerebellar infarction at 1 h and 23 min after symptom
                onset. Thrombolysis was not given due to a National Institute of Health stroke score (NIHSS) of 0. Maps are from the Siemens syngo.CT
                Neuro perfusion package which include (A) MTT, (B) Tmax, (C) CBV and (D) CBF. Images demonstrate an acute right cerebellar
                perfusion lesion with involvement of the superior cerebellar artery (SCA) vascular territory. No vessel occlusion was visualised on CT
                angiography. The perfusion lesion is most prominent on the (A) MTT and (B) Tmax and (D) CBF maps. Perfusion maps from the same
                acute posterior circulation stroke seen in Figure 1A-D. Map outputs are from the MiStar neuro perfusion package which include (E) MTT,
                (F) DT, (G) CBV and (H) CBF. Images demonstrate an acute right cerebellar lesion most evident on the (E) Tmax, (F) DT and (G) CBF
                maps. Similar to the Siemens syngo.CT Neuro perfusion package, the acute lesion is not well visualised on the CBV map. There is a
                notable difference in the volume of the perfusion lesion seen across the packages. This reflects the different algorithms employed by the
                two software proprietors in determination of the perfusion maps. Evolution of the acute posterior circulation stroke demonstrated in
                Figure 1. (I) Initial non-contrast CT at 1 h and 23 min after symptom onset demonstrates no acute change. (J) Initial automated core-
                penumbra map from the MiStar neuro perfusion package using the conventional thresholds for core and penumbra of CBV < 30% and
                DT > 3 s demonstrates no detectable perfusion lesion (although this may also relate to the relatively small size of the lesion as the
                software has a minimum volume criteria for core/penumbra to try to reduce false core/penumbra from noise). (K) Progress diffusion
                weighted magnetic resonance imaging at 20 h and 30 min after onset of symptoms demonstrating an established left cerebellar infarct.
                MTT: Mean transit time; CBV: cerebral blood volume; CBF: cerebral blood flow; DT: delay time.

               Tmax

               Tmax is also known as the time of peak of the deconvolved tissue residual function . This parameter
                                                                                          [32]
               represents the time from arterial peak to the peak of the tissue concentration curve, after a deconvolution
               algorithm has been applied. This measure is sensitive to delay in arrival of the contrast bolus. Indeed, in
               normal tissue Tmax should equal zero.

