Page 52 - Read Online
P. 52

Ashenhurst et al. Vessel Plus 2024;8:3  https://dx.doi.org/10.20517/2574-1209.2023.90                                                                                   Page 7 of 15


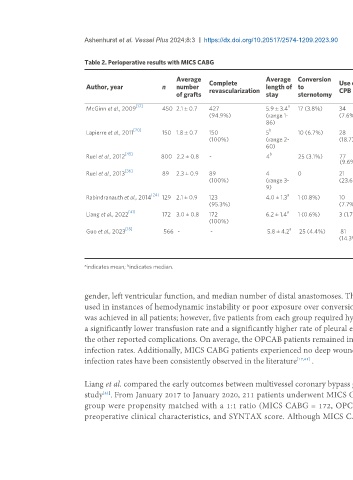
                              Table 2. Perioperative results with MICS CABG

                                                                                                                                                                                               Additional PCI
                                                            Average                        Average  Conversion                               Perioperative  New onset               Deep
                              Author, year              n   number      Complete           length of  to           Use of  Perioperative     blood           atrial       Pleural   wound      intervention at the
                                                            of grafts   revascularization  stay      sternotomy    CPB      mortality        transfusion     fibrillation  effusion  infection  time of
                                                                                                                                                                                               hospitalization
                                               [17]                                               a
                              McGinn et al., 2009       450 2.1 ± 0.7   427                5.9 ± 3.4    17 (3.8%)  34       6 (1.3%)         96 (21.3%)      24.4%        9.1%      0          17 (3.8%)
                                                                        (94.9%)            (range 1-               (7.6%)
                                                                                           86)
                                              [20]                                          b
                              Lapierre et al., 2011     150 1.8 ± 0.7   150                5         10 (6.7%)     28       0                13 (8.7%)       35 (23.3%)   22        0          5 (3.3%)
                                                                        (100%)             (range 2-               (18.7)                                                 (14.7%)
                                                                                           60)
                                           [45]                                             b
                              Ruel et al., 2012               800  2.2 ± 0.8  -            4          25 (3.1%)    77       -                -               18 (23.4%)   -         -          -
                                                                                                                    (9.6%)
                                           [36]
                              Ruel et al., 2013         89  2.3 ± 0.9   89                 4         0             21       0                24 (26%)        15 (17%)     14 (15%)  0          -
                                                                        (100%)             (range 3-               (23.6%)
                                                                                           9)
                                                    [24]                                          a
                              Rabindranauth et al., 2014  129 2.1 ± 0.9  123               4.0 ± 1.3  1 (0.8%)     10       0                17 (13%)        26 (20.1%)   2 (1.5%)  0          3 (2.3%)
                                                                        (95.3%)                                    (7.7%)
                                            [41]                                                  a
                              Liang et al., 2022        172 3.0 ± 0.8   172                6.2 ± 1.4  1 (0.6%)     3 (1.7%) 0                2 (1.2%)        35 (20.4%)   -         -          -
                                                                        (100%)
                                           [18]                                                    a
                              Guo et al., 2023          566 -           -                  5.8 ± 4.2  25 (4.4%)     81      1 (0.2%, massive   20 (3.5%)     111 (19.6%)  8         0          35 (6.2%)
                                                                                                                   (14.3%) pulmonary                                      (1.1%)
                                                                                                                            embolism at
                                                                                                                            discharge)


                                            b
                              a indicates mean;  indicates median.


                              gender, left ventricular function, and median number of distal anastomoses. The use of CPB assistance was more likely in MICS CABG than OPCAB and was

                              used in instances of hemodynamic instability or poor exposure over conversion to sternotomy and had no clinical implications. Complete revascularization
                              was achieved in all patients; however, five patients from each group required hybrid revascularization during their hospital stay. The MICS CABG patients had
                              a significantly lower transfusion rate and a significantly higher rate of pleural effusion in comparison to OPCAB groups. There was no statistical difference in
                              the other reported complications. On average, the OPCAB patients remained in the hospital for 1 day longer than MICS CABG patients and had higher wound

                              infection rates. Additionally, MICS CABG patients experienced no deep wound infection compared to the 6 (4.0%) OPCAB patients who did. Similar wound
                              infection rates have been consistently observed in the literature      [17,41]  .


                              Liang et al. compared the early outcomes between multivessel coronary bypass grafting by a sternotomy or a mini-thoracotomy in a retrospective single-center
                                    [41]
                              study . From January 2017 to January 2020, 211 patients underwent MICS CABG and 371 underwent conventional OPCAB. Patients in the MICS CABG
                              group were propensity matched with a 1:1 ratio (MICS CABG = 172, OPCAB = 172) with those in the OPCAB group based on epidemiological data,
                              preoperative clinical characteristics, and SYNTAX score. Although MICS CABG surgery was associated with longer operative times, those patients who
   47   48   49   50   51   52   53   54   55   56   57