
Page 141 - Read Online
P. 141
Broadwin et al. Vessel Plus 2023;7:25 https://dx.doi.org/10.20517/2574-1209.2023.103 Page 9 of 14
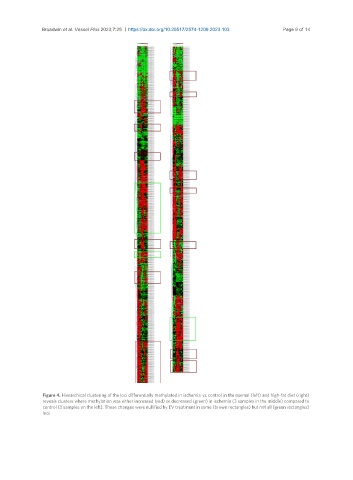
Figure 4. Hierarchical clustering of the loci differentially methylated in ischemia vs. control in the normal (left) and high-fat diet (right)
reveals clusters where methylation was either increased (red) or decreased (green) in ischemia (3 samples in the middle) compared to
control (3 samples on the left). These changes were nullified by EV treatment in some (brown rectangles) but not all (green rectangles)
loci.