Page 91 - Read Online
P. 91

Page 6 of 16                            Sun et al. Soft Sci. 2025, 5, 35  https://dx.doi.org/10.20517/ss.2025.21


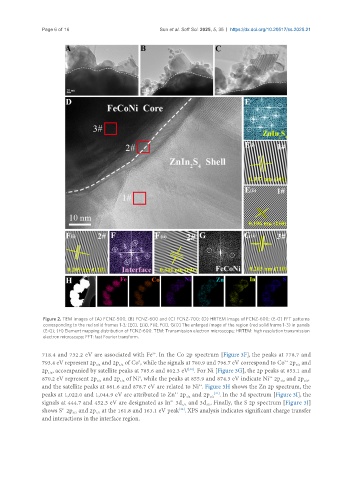
                Figure 2. TEM images of (A) FCNZ-500, (B) FCNZ-600 and (C) FCNZ-700; (D) HRTEM image of FCNZ-600; (E-G) FFT patterns
                corresponding to the red solid frames 1-3; [E(i), E(ii), F(i), F(ii), G(i)] The enlarged image of the region (red solid frame 1-3) in panels
                (E-G); (H) Element mapping distribution of FCNZ-600. TEM: Transmission electron microscope; HRTEM: high resolution transmission
                electron microscopy; FFT: fast Fourier transform.


               718.4 and 732.2 eV are associated with Fe . In the Co 2p spectrum [Figure 3F], the peaks at 778.7 and
                                                    3+
                                                0
               793.4 eV represent 2p  and 2p  of Co , while the signals at 780.9 and 796.7 eV correspond to Co  2p  and
                                                                                                 2+
                                 3/2
                                                                                                     3/2
                                         1/2
               2p , accompanied by satellite peaks at 785.6 and 802.3 eV . For Ni [Figure 3G], the 2p peaks at 853.1 and
                                                                 [40]
                 1/2
               870.2 eV represent 2p  and 2p  of Ni , while the peaks at 855.9 and 874.3 eV indicate Ni  2p  and 2p ,
                                                0
                                                                                            2+
                                                                                                3/2
                                                                                                       1/2
                                          1/2
                                  3/2
                                                                    2+
               and the satellite peaks at 861.6 and 878.7 eV are related to Ni . Figure 3H shows the Zn 2p spectrum, the
                                                            2+
               peaks at 1,022.0 and 1,044.9 eV are attributed to Zn  2p  and 2p 1/2 [41] . In the 3d spectrum [Figure 3I], the
                                                                3/2
               signals at 444.7 and 452.3 eV are designated as In  3d  and 3d . Finally, the S 2p spectrum [Figure 3J]
                                                          3+
                                                                       3/2
                                                              5/2
               shows S  2p  and 2p  at the 161.8 and 163.1 eV peak . XPS analysis indicates significant charge transfer
                                                             [42]
                      2-
                         3/2
                                 1/2
               and interactions in the interface region.
   86   87   88   89   90   91   92   93   94   95   96