
Page 122 - Read Online
P. 122
Page 4 of 19 Kim et al. Soft Sci 2023;3:18 https://dx.doi.org/10.20517/ss.2023.08
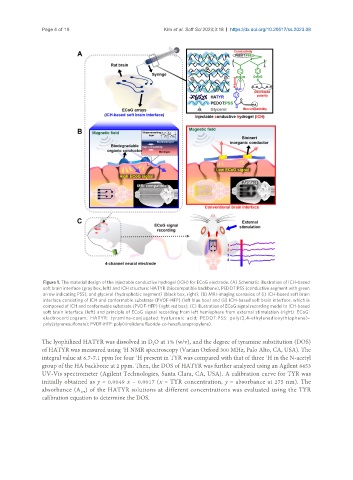
Figure 1. The material design of the injectable conductive hydrogel (ICH) for ECoG electrode. (A) Schematic illustration of ICH-based
soft brain interface (gray box, left) and ICH structure: HATYR (biocompatible backbone), PEDOT:PSS (conductive segment with green
arrow indicating PSS), and glycerol (hydrophobic segment) (black box, right); (B) MRI-imaging scenarios of (i) ICH-based soft brain
interface consisting of ICH and conformable substrate (PVDF-HFP) (left blue box) and (ii) ICH-based soft brain interface, which is
composed of ICH and conformable substrate (PVDF-HFP) (right red box); (C) Illustration of ECoG signal recording model to ICH-based
soft brain interface (left) and principle of ECoG signal recording from left hemisphere from external stimulation (right). ECoG:
electrocorticogram; HATYR: tyramine-conjugated hyaluronic acid; PEDOT:PSS: poly(3,4-ethylenedioxythiophene)-
poly(styrenesulfonate); PVDF-HFP: poly(vinylidene fluoride-co-hexafluoropropylene).
The lyophilized HATYR was dissolved in D O at 1% (w/v), and the degree of tyramine substitution (DOS)
2
of HATYR was measured using H NMR spectroscopy (Varian Oxford 300 MHz, Palo Alto, CA, USA). The
1
1
1
integral value at 6.7-7.1 ppm for four H present in TYR was compared with that of three H in the N-acetyl
group of the HA backbone at 2 ppm. Then, the DOS of HATYR was further analyzed using an Agilent 8453
UV-Vis spectrometer (Agilent Technologies, Santa Clara, CA, USA). A calibration curve for TYR was
initially obtained as y = 0.0049 x − 0.0017 (x = TYR concentration, y = absorbance at 275 nm). The
absorbance (A ) of the HATYR solutions at different concentrations was evaluated using the TYR
275
calibration equation to determine the DOS.