
Page 523 - Read Online
P. 523
Corthouts et al. Plast Aesthet Res 2020;7:46 I http://dx.doi.org/10.20517/2347-9264.2020.97 Page 9 of 15
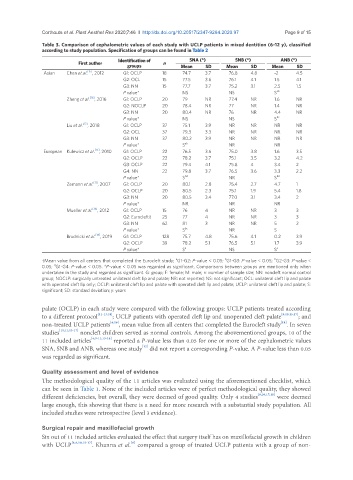
Table 3. Comparison of cephalometric values of each study with UCLP patients in mixed dentition (6-12 y), classified
according to study population. Specification of groups can be found in Table 2
First author Identification of n SNA (°) SNB (°) ANB (°)
groups Mean SD Mean SD Mean SD
[15]
Asian Chen et al. , 2012 G1: OCLP 18 74.7 3.7 76.8 4.8 -2 4.5
G2: OCL 15 77.5 3.6 76.1 4.1 1.5 4.1
G3: NN 15 77.7 3.7 75.2 3.1 2.5 1.5
P value* NS NS S ab
Zheng et al. [16] , 2016 G1: OCLP 20 79 NR 77.4 NR 1.6 NR
G2: NOCLP 20 78.4 NR 77 NR 1.4 NR
G3: NN 20 80.4 NR 76 NR 4.4 NR
P value* NS NS S bc
[17]
Liu et al. , 2018 G1: OCLP 37 75.1 3.9 NR NR NR NR
G2: OCL 37 79.3 3.3 NR NR NR NR
G3: NN 37 80.2 3.9 NR NR NR NR
P value* S ab NR NR
[13]
European Kulewicz et al. , 2010 G1: OCLP 22 76.5 3.6 75.0 3.8 1.6 3.5
G2: OCLP 22 78.2 3.7 75.1 3.5 3.2 4.2
G3: OCLP 22 79.4 4.1 75.8 4 3.4 2
G4: NN 22 79.8 3.7 76.5 3.6 3.3 2.2
P value* S bd NR S bd
[11]
Zemann et al. , 2007 G1: OCLP 20 80.1 2.8 75.4 2.7 4.7 1
G2: OCLP 20 80.5 2.3 75.1 1.9 5.4 1.8
G3: NN 20 80.5 3.4 77.0 3.1 3.4 2
P value* NR NR NR
Mueller et al. [14] , 2012 G1: OCLP 15 76 4 NR NR 3 3
G2: Eurocleft† 25 77 4 NR NR 3 3
G3: NN 62 81 3 NR NR 5 2
P value* S bc NR S
Brudnicki et al. [18] , 2019 G1: OCLP 128 75.7 4.8 75.6 4.1 0.2 3.9
G2: OCLP 39 78.2 5.1 76.5 5.1 1.7 3.9
P value* S a NS S a
a
b
C
†Mean value from all centers that completed the Eurocleft study; G1-G2: P-value < 0.05; G1-G3: P-value < 0.05; G2-G3: P-value <
d
0.05; G1-G4: P-value < 0.05. *P-value < 0.05 was regarded as significant. Comparisons between groups are mentioned only when
undertaken in the study and regarded as significant. G: group; F: female; M: male; n: number of sample size; NN: noncleft normal control
group; NOCLP: surgically untreated unilateral cleft lip and palate; NR: not reported; NS: not significant; OCL: unilateral cleft lip and palate
with operated cleft lip only; OCLP: unilateral cleft lip and palate with operated cleft lip and palate; UCLP: unilateral cleft lip and palate; S:
significant; SD: standard deviation; y: years
palate (OCLP) in each study were compared with the following groups: UCLP patients treated according
to a different protocol [11-13,18] ; UCLP patients with operated cleft lip and unoperated cleft palate [9,10,15,17] ; and
[14]
non-treated UCLP patients [6,16] , mean value from all centers that completed the Eurocleft study . In seven
studies [10,11,13-17] noncleft children served as normal controls. Among the abovementioned groups, 10 of the
11 included articles [6,9-11,13-18] reported a P-value less than 0.05 for one or more of the cephalometric values
[12]
SNA, SNB and ANB, whereas one study did not report a corresponding P-value. A P-value less than 0.05
was regarded as significant.
Quality assessment and level of evidence
The methodological quality of the 11 articles was evaluated using the aforementioned checklist, which
can be seen in Table 1. None of the included articles were of perfect methodological quality, they showed
different deficiencies, but overall, they were deemed of good quality. Only 4 studies [9,10,17,18] were deemed
large enough, this showing that there is a need for more research with a substantial study population. All
included studies were retrospective (level 3 evidence).
Surgical repair and maxillofacial growth
Six out of 11 included articles evaluated the effect that surgery itself has on maxillofacial growth in children
[6]
with UCLP [6,9,10,15-17] . Khanna et al. compared a group of treated UCLP patients with a group of non-