
Page 27 - Read Online
P. 27
Pérez et al. End-to-side neurorrhaphy for early reinnervation
performed. Muscle cross sections were 60 nm thick,
and viewed with uranyl acetate and lead citrate contrast
(Reynolds, 1963) (EM 109 Carl Zeiss). Observations
and diameter measurements were made with an
Axioscop 2 plus microscope (Carl Zeiss) connected
to a system of image analysis. Axiovision 4.0 software
was used. All axons on the edges of the cut specimens
were excluded from the count.
Statistical analysis was performed using analysis of
variance (ANOVA), and an averages comparative
analysis (Tukey’s method) using Micro Cal Origin
Figure 2: Zones used for microscopic analysis (tibial, peroneal software.
and graft). Optical lenses original magnification ×400
RESULTS
entrance to the muscle. The injury was repaired with
an EEN in group 1. In group 2, an ESN was performed Muscle/nerve morphology, and thickness of
from the tibial to the peroneal nerve. In group 3, a the myelin band
direct EEN plus an ESN neurorrhaphy from the donor The morphology of nerves and muscles was different
nerve (tibial) was used. In both groups 2 and 3, a nerve in all groups. Three morphological conditions were
graft to bridge the gap between the tibial and peroneal found: normal in group 0; regeneration in groups 1, 2,
nerves was used. In group 4, only a neurotomy was and 3; and degeneration in groups 1, 2, and 4.
performed without reconstruction [Figure 1].
The peripheral region of the nerve displayed large
Morphological analysis amounts of connective and fatty tissue. In group 0,
Ninety days after neurotomy and repair, the animals the myelinated axons were situated in a semi-circular
were sacrificed with an anesthetic overdose. Nerve form, arranged one after another [Figure 3A]; myelin
fragments from several zones, as well as the band thickness ranged from 80 to 470 nm, with
corresponding muscles, were identified and marked the diameter of the fiber directly proportional to the
(z1 to z9) [Figure 2]. These were fixed in a combination thickness of the myelin band [Figure 4A]. In group 3,
of 4% paraformaldehyde and 2.5% glutaraldehyde in the main types of fibers were regenerative with a
a saline phosphate buffer solution (0.1 mol/L, pH 7.4). well-defined myelin band, with irregular and grouped
dispositions [Figure 3B]. Abundant connective tissue
Following fixation they were treated with 2% OsO , was found among these groups. The thickness of the
4
dehydrated with ethanol in increasing graduation, myelin band varied according to the diameter of the
and finally placed in epoxic resin (Epon). Axonal fiber and ranged from 40 to 280 nm [Figure 4B]. In
diameter and myelin density were determined in 1-mm groups 1 and 2, small regenerative axon fibers were
cross sections dyed with toluidine blue in zones 1 to found together with lost myelin architecture or only the
9. Axon and muscle ultrastructural analysis was also
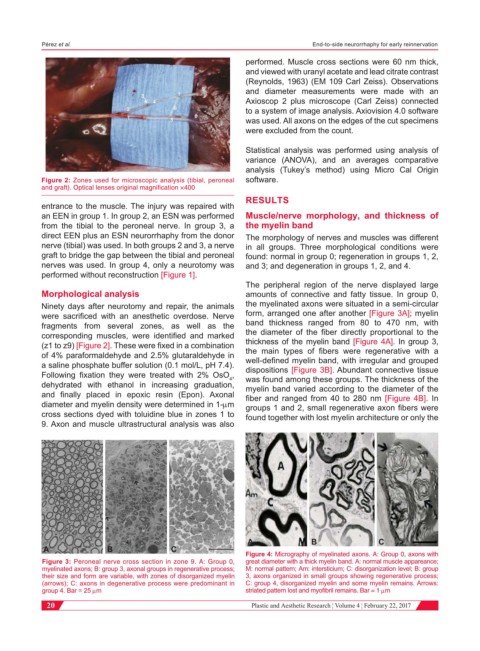
A B C
A B C
Figure 4: Micrography of myelinated axons. A: Group 0, axons with
Figure 3: Peroneal nerve cross section in zone 9. A: Group 0, great diameter with a thick myelin band. A: normal muscle appareance;
myelinated axons; B: group 3, axonal groups in regenerative process; M: normal pattern; Am: intersticium; C: disorganization level; B: group
their size and form are variable, with zones of disorganized myelin 3, axons organized in small groups showing regenerative process;
(arrows); C: axons in degenerative process were predominant in C: group 4, disorganized myelin and some myelin remains. Arrows:
group 4. Bar = 25 mm striated pattern lost and myofibril remains. Bar = 1 mm
20 Plastic and Aesthetic Research ¦ Volume 4 ¦ February 22, 2017