Page 388 - Read Online
P. 388
Kim et al.                                                                                                                                                                                                      Elasticum suspension

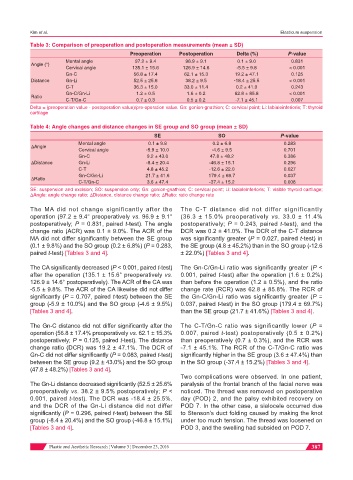
           Table 3: Comparison of preoperation and postoperation measurements (mean ± SD)
                                             Preoperation    Postoperation       Delta (%)        P-value
                       Mental angle            97.2 ± 9.4       96.9 ± 9.1       0.1 ± 9.0         0.831
           Angle (°)
                       Cervical angle         135.1 ± 15.6     126.9 ± 14.6      -5.5 ± 9.8        < 0.001
                       Gn-C                   56.8 ± 17.4      62.1 ± 15.3      19.2 ± 47.1        0.125
           Distance    Gn-Li                  52.5 ± 25.6       38.2 ± 9.5      -18.4 ± 25.5       < 0.001
                       C-T                    36.3 ± 15.0      33.0 ± 11.4       0.2 ± 41.0        0.243
                       Gn-C/Gn-Li              1.2 ± 0.5        1.6 ± 0.2       62.8 ± 85.8        < 0.001
           Ratio
                       C-T/Gn-C                0.7 ± 0.3        0.5 ± 0.2       -7.1 ± 45.1        0.007
           Delta = (preoperation value - postoperation value)/pre-operation value. Gn: gonion-gnathion; C: cervical point; Li: labialeinferioris; T: thyroid
           cartilage

           Table 4: Angle changes and distance changes in SE group and SO group (mean ± SD)
                                                     SE                    SO                   P-value
                            Mental angle           0.1 ± 9.8             0.2 ± 6.8               0.283
           ΔAngle
                            Cervical angle        -5.9 ± 10.0           -4.6 ± 9.5               0.701
                            Gn-C                   9.2 ± 43.0           47.8 ± 48.2              0.386
           ΔDistance        Gn-Li                 -8.4 ± 20.4           -46.8 ± 15.1             0.296
                            C-T                    4.8 ± 45.2           -12.6 ± 22.0             0.027
                            Gn-C/Gn-Li            21.7 ± 41.6          179.4 ± 69.7              0.037
           ΔRatio
                            C-T/Gn-C               3.6 ± 47.4           -37.4 ± 15.2             0.008
           SE: suspension and excision; SO: suspension only; Gn: gonion-gnathion; C: cervical point; Li: labialeinferioris; T: visible thyroid cartilage;
           ΔAngle: angle change ratio; ΔDistance, distance change ratio; ΔRatio: ratio change rate

           The MA did not change significantly after the      The C-T distance did not differ significantly
           operation (97.2 ± 9.4° preoperatively vs. 96.9 ± 9.1°   (36.3 ± 15.0% preoperatively  vs. 33.0 ± 11.4%
           postoperatively; P = 0.831, paired t-test). The angle   postoperatively; P = 0.243, paired t-test), and the
           change ratio (ACR) was 0.1 ± 9.0%. The ACR of the   DCR was 0.2 ± 41.0%. The DCR of the C-T distance
           MA did not differ significantly between the SE group   was significantly greater (P = 0.027, paired t-test) in
           (0.1 ± 9.8%) and the SO group (0.2 ± 6.8%) (P = 0.283,   the SE group (4.8 ± 45.2%) than in the SO group (-12.6
           paired t-test) [Tables 3 and 4].                   ± 22.0%) [Tables 3 and 4].

           The CA significantly decreased (P < 0.001, paired t-test)   The Gn-C/Gn-Li ratio was significantly greater (P <
           after the operation (135.1 ± 15.6° preoperatively vs.   0.001, paired t-test) after the operation (1.6 ± 0.2%)
           126.9 ± 14.6° postoperatively). The ACR of the CA was   than before the operation (1.2 ± 0.5%), and the ratio
           -5.5 ± 9.8%. The ACR of the CA likewise did not differ   change rate (RCR) was 62.8 ± 85.8%. The RCR of
           significantly (P = 0.707, paired t-test) between the SE   the Gn-C/Gn-Li ratio was significantly greater (P =
           group (-5.9 ± 10.0%) and the SO group (-4.6 ± 9.5%)   0.037, paired t-test) in the SO group (179.4 ± 69.7%)
           [Tables 3 and 4].                                  than the SE group (21.7 ± 41.6%) [Tables 3 and 4].

           The Gn-C distance did not differ significantly after the   The C-T/Gn-C ratio was significantly lower (P =
           operation (56.8 ± 17.4% preoperatively vs. 62.1 ± 15.3%   0.007, paired t-test) postoperatively (0.5 ± 0.2%)
           postoperatively; P = 0.125, paired t-test). The distance   than preoperatively (0.7 ± 0.3%), and the RCR was
           change ratio (DCR) was 19.2 ± 47.1%. The DCR of    -7.1 ± 45.1%. The RCR of the C-T/Gn-C ratio was
           Gn-C did not differ significantly (P = 0.083, paired t-test)   significantly higher in the SE group (3.6 ± 47.4%) than
           between the SE group (9.2 ± 43.0%) and the SO group   in the SO group (-37.4 ± 15.2%) [Tables 3 and 4].
           (47.8 ± 48.2%) [Tables 3 and 4].
                                                              Two complications were observed. In one patient,
           The Gn-Li distance decreased significantly (52.5 ± 25.6%   paralysis of the frontal branch of the facial nerve was
           preoperatively vs. 38.2 ± 9.5% postoperatively; P <   noticed. The thread was removed on postoperative
           0.001, paired t-test). The DCR was -18.4 ± 25.5%,   day (POD) 2, and the palsy exhibited recovery on
           and the DCR of the Gn-Li distance did not differ   POD 7. In the other case, a sialocele occurred due
           significantly (P = 0.296, paired t-test) between the SE   to Stenson’s duct folding caused by making the knot
           group (-8.4 ± 20.4%) and the SO group (-46.8 ± 15.1%)   under too much tension. The thread was loosened on
           [Tables 3 and 4].                                  POD 3, and the swelling had subsided on POD 7.


                           Plastic and Aesthetic Research ¦ Volume 3 ¦ December 23, 2016                  387

