
Page 297 - Read Online
P. 297
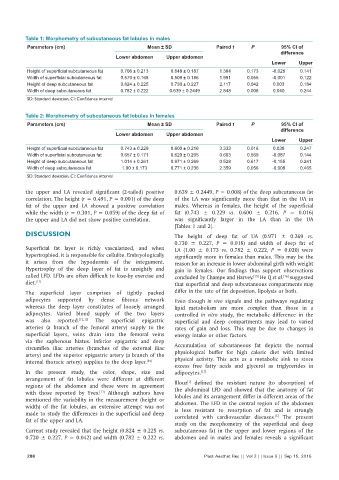
Table 1: Morphometry of subcutaneous fat lobules in males
           Parameters (cm)                           Mean ± SD               Paired t    P          95% CI of
                                                                                                    difference
                                          Lower abdomen    Upper abdomen
                                                                                                Lower     Upper
           Height of superficial subcutaneous fat  0.706 ± 0.213  0.648 ± 0.187  1.394  0.173    -0.026   0.141
           Width of superficial subcutaneous fat  0.570 ± 0.168  0.509 ± 0.186  1.991   0.055    -0.001   0.122
           Height of deep subcutaneous fat  0.824 ± 0.225    0.730 ± 0.227    2.117     0.042    0.003    0.184
           Width of deep subcutaneous fat  0.782 ± 0.222     0.639 ± 0.2449   2.848     0.008    0.040    0.244
           SD: Standard deviation, CI: Confidence interval


          Table 2: Morphometry of subcutaneous fat lobules in females
           Parameters (cm)                           Mean ± SD               Paired t    P          95% CI of
                                                                                                    difference
                                          Lower abdomen    Upper abdomen
                                                                                                Lower     Upper
           Height of superficial subcutaneous fat  0.743 ± 0.229  0.600 ± 0.216  3.333  0.016    0.038    0.247
           Width of superficial subcutaneous fat  0.657 ± 0.171  0.629 ± 0.205  0.603   0.569    -0.087   0.144
           Height of deep subcutaneous fat  1.014 ± 0.261    0.971 ± 0.269    0.528     0.617    -0.155   0.241
           Width of deep subcutaneous fat   1.00 ± 0.173     0.771 ± 0.236    2.359     0.056    -0.008   0.465
           SD: Standard deviation, CI: Confidence interval

          the upper and LA revealed significant  (2‑tailed)  positive   0.639 ± 0.2449, P = 0.008) of the deep subcutaneous fat
          correlation. The height (r = 0.491, P = 0.001) of the deep   of the LA was significantly  more than that in the UA in
          fat of the  upper  and LA  showed a positive  correlation   males.  Whereas  in  females,  the  height  of the  superficial
          while the width (r = 0.301, P = 0.059) of the deep fat of   fat (0.743  ±  0.229  vs. 0.600  ±  0.216, P  =  0.016)
          the upper and LA did not show positive correlation.  was significantly  larger  in  the  LA  than  in  the  UA
                                                              [Tables 1 and 2].
          DISCUSSION                                          The  height  of  deep  fat  of  UA  (0.971  ±  0.269  vs.
                                                              0.730  ±  0.227, P  =  0.018) and width of deep fat of
          Superficial fat layer is richly vascularized, and when   LA (1.00  ±  0.173  vs. 0.782  ±  0.222, P  =  0.020) were
          hypertrophied, it is responsible for cellulite. Embryologically   significantly more in females than males. This may be the
          it  arises from the  hypodermis  of the  integument.   reason for an increase in lower abdominal girth with weight
          Hypertrophy of the deep layer of fat is unsightly and   gain in females. Our findings thus support observations
          called LFD. LFDs are often difficult to lose‑by exercise and   concluded by Champe and Harvey.  He Q et al.  suggested
                                                                                          [15]
                                                                                                     [16]
          diet. [11]                                          that superficial and deep subcutaneous compartments may
          The superficial layer comprises  of tightly  packed   differ in the rate of fat deposition, lipolysis or both.
          adipocytes supported by  dense  fibrous  network    Even though in  vivo  signals and the pathways regulating
          whereas the deep layer constitutes of loosely arranged   lipid metabolism are more complex than those in a
          adipocytes. Varied blood supply of the two layers   controlled  in  vitro  study, the metabolic difference in the
          was also reported. [12,13]  The superficial epigastric   superficial and deep compartments  may  lead to  varied
          arteries (a  branch of the femoral artery) supply  to the   rates of gain  and loss. This may be  due to changes in
          superficial layers,  veins  drain  into  the  femoral veins   energy intake or other factors.
          via the saphenous hiatus.  Inferior epigastric  and deep
          circumflex iliac arteries (branches of the external iliac   Accumulation of subcutaneous fat depicts the normal
          artery) and the superior epigastric artery (a branch of the   physiological buffer  for high  caloric diet  with  limited
          internal thoracic artery) supplies to the deep layer. [14]  physical activity.  This acts as a metabolic sink to store
                                                              excess free fatty acids and glycerol as triglycerides in
          In  the  present  study,  the  color,  shape,  size  and   adipocytes. [17]
          arrangement  of fat lobules were different at different   Illouz  defined the resistant  nature  (to absorption) of
                                                                   [1]
          regions of the abdomen and these were in agreement   the abdominal LFD and showed that the anatomy of fat
          with those reported by Yves.  Although authors have   lobules and its arrangement differ in different areas of the
                                    [11]
          mentioned  the  variability  in  the  measurement  (height  or   abdomen. The LFD in the central region of the abdomen
          width) of the fat lobules, an extensive  attempt was not   is less resistant to resorption of fat and is strongly
          made to study the differences in the superficial and deep   correlated  with  cardiovascular diseases.   The  present
                                                                                                  [5]
          fat of the upper and LA.
                                                              study  on  the  morphometry  of the  superficial and deep
          Current study revealed that the height (0.824 ± 0.225 vs.   subcutaneous fat in the upper and lower regions of the
          0.730 ± 0.227, P = 0.042) and width (0.782 ± 0.222 vs.   abdomen and in males  and females  reveals  a significant


           288                                                           Plast Aesthet Res || Vol 2 || Issue 5 || Sep 15, 2015