
Page 17 - Read Online
P. 17
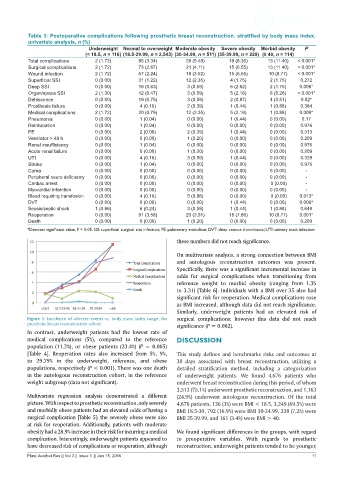
Table 3: Postoperative complications following prosthetic breast reconstruction, stratified by body mass index,
           univariate analysis, n (%)
                                Underweight  Normal to overweight Moderate obesity  Severe obesity  Morbid obesity  P
                               (< 18.5, n = 116) (18.5-29.99, n = 2,543) (30-34.99, n = 511) (35-39.99, n = 229) (≥ 40, n = 114)
           Total complications    2 (1.72)        85 (3.34)       28 (5.48)      19 (8.30)     13 (11.40)            < 0.001*
           Surgical complications  2 (1.72)       73 (2.87)       21 (4.11)      15 (6.55)     13 (11.40)  < 0.001*
           Wound infection        2 (1.72)        57 (2.24)       18 (3.52)      15 (6.55)     10 (8.77)  < 0.001*
           Superficial SSI        0 (0.00)        31 (1.22)       12 (2.35)       4 (1.75)      2 (1.75)   0.272
           Deep SSI               0 (0.00)        16 (0.63)        3 (0.59)       6 (2.62)      2 (1.75)  0.006*
           Organ/space SSI        2 (1.30)        12 (0.47)        3 (0.59)       5 (2.18)      6 (5.26)  < 0.001*
           Dehiscence             0 (0.00)        19 (0.75)        3 (0.59)       2 (0.87)      4 (3.51)   0.02*
           Prosthesis failure     0 (0.00)        4 (0.16)         2 (0.39)       1 (0.44)      1 (0.88)   0.384
           Medical complications  2 (1.72)        20 (0.79)       12 (2.35)       5 (2.18)      1 (0.88)  0.009*
           Pneumonia              0 (0.00)        1 (0.04)         0 (0.00)       1 (0.44)      0 (0.00)   0.17
           Reintubation           0 (0.00)        1 (0.04)         0 (0.00)       0 (0.00)      0 (0.00)   0.976
           PE                     0 (0.00)        2 (0.08)         2 (0.39)       1 (0.44)      0 (0.00)   0.313
           Ventilator > 48 h      0 (0.00)        0 (0.00)         1 (0.20)       0 (0.00)      0 (0.00)   0.209
           Renal insufficiency    0 (0.00)        1 (0.04)         0 (0.00)       0 (0.00)      0 (0.00)   0.976
           Acute renal failure    0 (0.00)        0 (0.00)         1 (0.20)       0 (0.00)      0 (0.00)   0.209
           UTI                    0 (0.00)        4 (0.16)         3 (0.59)       1 (0.44)      0 (0.00)   0.329
           Stroke                 0 (0.00)        1 (0.04)         0 (0.00)       0 (0.00)      0 (0.00)   0.976
           Coma                   0 (0.00)        0 (0.00)         0 (0.00)       0 (0.00)      0 (0.00)              ‑
           Peripheral neuro deficiency  0 (0.00)  0 (0.00)         0 (0.00)       0 (0.00)      0 (0.00)              ‑
           Cardiac arrest         0 (0.00)        0 (0.00)         0 (0.00)       0 (0.00)       0 (0.00)              ‑
           Myocardial Infarction  0 (0.00)        0 (0.00)         0 (0.00)       0 (0.00)      0 (0.00)              ‑
           Bleed requiring transfusion  0 (0.00)  4 (0.16)         5 (0.98)       0 (0.00)       0 (0.00)             0.013*
           DVT                    0 (0.00)        0 (0.00)         0 (0.00)       1 (0.44)      0 (0.00)             0.006*
           Sepsis/septic shock    1 (0.86)        6 (0.24)         3 (0.59)       1 (0.44)      1 (0.88)             0.646
           Reoperation            0 (0.00)        91 (3.58)       20 (3.91)      18 (7.86)     10 (8.77)           0.001*
           Death                  0 (0.00)        0 (0.00)         1 (0.20)       0 (0.00)      0 (0.00)             0.209
           *Denotes significant value, P < 0.05. SSI: superficial surgical site infection; PE: pulmonary embolism; DVT: deep venous thrombosis; UTI: urinary tract infection
                                                               these numbers did not reach significance.

                                                               On multivariate analysis, a strong connection between BMI
                                                               and autologous reconstruction outcomes was present.
                                                               Specifically, there was a significant incremental increase in
                                                               odds for surgical complications when transitioning  from
                                                               reference weight to morbid obesity (ranging from 1.35
                                                               to 3.31) [Table 6]. Individuals with a BMI over 35 also had
                                                               significant risk for reoperation. Medical complications rose
                                                               as BMI increased, although data did not reach significance.
                                                               Similarly,  underweight  patients  had an  elevated risk  of
           Figure 1: Incidence of adverse events vs. body mass index range, for   surgical complications; however  this  data did not reach
           prosthetic breast reconstruction cohort             significance (P = 0.062).
           In contrast, underweight  patients had the  lowest rate of
           medical complications (5%),  compared to the reference   DISCUSSION
           population (11.2%),  or obese  patients  (23.4%)  (P = 0.005)
           [Table 4]. Reoperation rates also increased from 5%, 9%,   This study defines and benchmarks risks and outcomes at
           to 29.79%  in the underweight,  reference, and obese   30  days  associated  with  breast  reconstruction,  utilizing  a
           populations, respectively (P < 0.001). There was one death   detailed stratification method, including a categorization
           in  the  autologous reconstruction cohort, in  the  reference   of  underweight  patients.  We  found  4,676  patients  who
           weight subgroup (data not significant).             underwent breast reconstruction during this period, of whom
                                                               3,513 (75.1%) underwent prosthetic reconstruction, and 1,163
           Multivariate regression analysis demonstrated a different   (24.9%) underwent autologous reconstruction. Of the total
           picture. With respect to prosthetic reconstruction, only severely   4,676 patients, 136 (3%) were BMI < 18.5, 3,249 (69.5%) were
           and morbidly obese patients had an elevated odds of having a   BMI 18.5-30, 792 (16.9%) were BMI 30-34.99, 338 (7.2%) were
           surgical complication [Table 5]; the severely obese were also   BMI 35-39.99, and 161 (3.4%) were BMI > 40.
           at risk for reoperation. Additionally, patients with moderate
           obesity had a 28.9% increase in their risk for incurring a medical   We found significant differences in the groups, with regard
           complication. Interestingly, underweight patients appeared to   to preoperative variables. With regards to prosthetic
           have decreased risk of complications or reoperation, although   reconstruction, underweight patients tended to be younger,
           Plast Aesthet Res || Vol 3 || Issue 1  || Jan 15, 2016                                              11