
Page 11 - Read Online
P. 11
Larshans et al. Plast Aesthet Res. 2025;12:7 https://dx.doi.org/10.20517/2347-9264.2024.154 Page 5 of 13
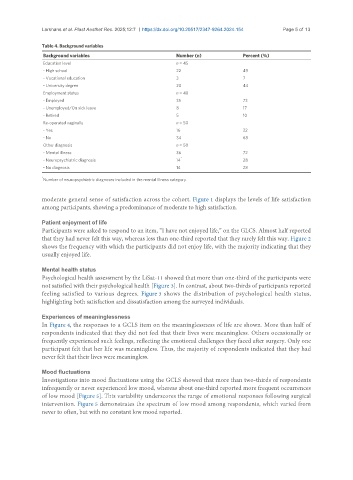
Table 4. Background variables
Background variables Number (n) Percent (%)
Education level n = 45
- High school 22 49
- Vocational education 3 7
- University degree 20 44
Employment status n = 48
- Employed 35 73
- Unemployed/On sick leave 8 17
- Retired 5 10
Re-operated vaginally n = 50
- Yes 16 32
- No 34 68
Other diagnosis n = 50
- Mental illness 36 72
*
- Neuropsychiatric diagnosis 14 28
- No diagnosis 14 28
*
Number of neuropsychiatric diagnoses included in the mental illness category.
moderate general sense of satisfaction across the cohort. Figure 1 displays the levels of life satisfaction
among participants, showing a predominance of moderate to high satisfaction.
Patient enjoyment of life
Participants were asked to respond to an item, “I have not enjoyed life,” on the GLCS. Almost half reported
that they had never felt this way, whereas less than one-third reported that they rarely felt this way. Figure 2
shows the frequency with which the participants did not enjoy life, with the majority indicating that they
usually enjoyed life.
Mental health status
Psychological health assessment by the LiSat-11 showed that more than one-third of the participants were
not satisfied with their psychological health [Figure 3]. In contrast, about two-thirds of participants reported
feeling satisfied to various degrees. Figure 3 shows the distribution of psychological health status,
highlighting both satisfaction and dissatisfaction among the surveyed individuals.
Experiences of meaninglessness
In Figure 4, the responses to a GCLS item on the meaninglessness of life are shown. More than half of
respondents indicated that they did not feel that their lives were meaningless. Others occasionally or
frequently experienced such feelings, reflecting the emotional challenges they faced after surgery. Only one
participant felt that her life was meaningless. Thus, the majority of respondents indicated that they had
never felt that their lives were meaningless.
Mood fluctuations
Investigations into mood fluctuations using the GCLS showed that more than two-thirds of respondents
infrequently or never experienced low mood, whereas about one-third reported more frequent occurrences
of low mood [Figure 5]. This variability underscores the range of emotional responses following surgical
intervention. Figure 5 demonstrates the spectrum of low mood among respondents, which varied from
never to often, but with no constant low mood reported.