
Page 69 - Read Online
P. 69
Page 6 of 11 Diamond et al. Plast Aesthet Res 2019;6:20 I http://dx.doi.org/10.20517/2347-9264.2019.26
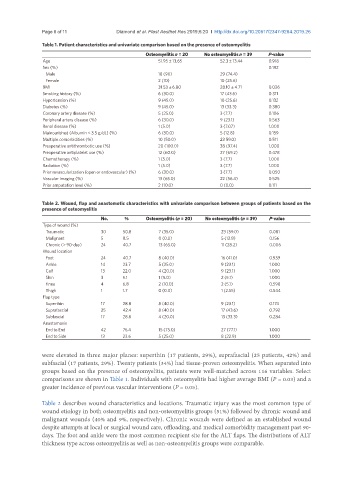
Table 1. Patient characteristics and univariate comparison based on the presence of osteomyelitis
Osteomyelitis n = 20 No osteomyelitis n = 39 P-value
Age 51.95 ± 13.65 52.3 ± 13.44 0.918
Sex (%) 0.192
Male 18 (90) 29 (74.4)
Female 2 (10) 10 (25.6)
BMI 31.53 ± 6.80 28.10 ± 4.71 0.026
Smoking history (%) 6 (30.0) 17 (43.6) 0.311
Hypertension (%) 9 (45.0) 10 (25.6) 0.132
Diabetes (%) 9 (45.0) 13 (33.3) 0.380
Coronary artery disease (%) 5 (25.0) 3 (7.7) 0.106
Peripheral artery disease (%) 6 (30.0) 9 (23.1) 0.563
Renal disease (%) 1 (5.0) 3 (7.07) 1.000
Malnourished (Albumin < 3.5 g/dL) (%) 6 (30.0) 5 (12.8) 0.159
Multiple comorbidities (%) 10 (50.0) 23 59.0) 0.511
Preoperative antithrombotic use (%) 20 (100.0) 38 (97.4) 1.000
Preoperative antiplatelet use (%) 12 (60.0) 27 (69.2) 0.478
Chemotherapy (%) 1 (5.0) 3 (7.7) 1.000
Radiation (%) 1 (5.0) 3 (7.7) 1.000
Prior revascularization (open or endovascular) (%) 6 (30.0) 3 (7.7) 0.050
Vascular imaging (%) 13 (65.0) 22 (56.4) 0.525
Prior amputation level (%) 2 (10.0) 0 (0.0) 0.111
Table 2. Wound, flap and anastomotic characteristics with univariate comparison between groups of patients based on the
presence of osteomyelitis
No. % Osteomyelitis (n = 20) No osteomyelitis (n = 39) P-value
Type of wound (%)
Traumatic 30 50.8 7 (35.0) 23 (59.0) 0.081
Malignant 5 8.5 0 (0.0) 5 (12.8) 0.156
Chronic (> 90-day) 24 40.7 13 (65.0) 11 (28.2) 0.006
Wound location
Foot 24 40.7 8 (40.0) 16 (41.0) 0.939
Ankle 14 23.7 5 (25.0) 9 (23.1) 1.000
Calf 13 22.0 4 (20.0) 9 (23.1) 1.000
Shin 3 5.1 1 (5.0) 2 (5.1) 1.000
Knee 4 6.8 2 (10.0) 2 (5.1) 0.598
Thigh 1 1.7 0 (0.0) 1 (2.55) 0.544
Flap type
Superthin 17 28.8 8 (40.0) 9 (23.1) 0.174
Suprafascial 25 42.4 8 (40.0) 17 (43.6) 0.792
Subfascial 17 28.8 4 (20.0) 13 (33.3) 0.284
Anastomosis
End to End 42 76.4 15 (75.0) 27 (77.1) 1.000
End to Side 13 23.6 5 (25.0) 8 (22.9) 1.000
were elevated in three major planes: superthin (17 patients, 29%), suprafascial (25 patients, 42%) and
subfascial (17 patients, 29%). Twenty patients (34%) had tissue-proven osteomyelitis. When separated into
groups based on the presence of osteomyelitis, patients were well-matched across 116 variables. Select
comparisons are shown in Table 1. Individuals with osteomyelitis had higher average BMI (P = 0.03) and a
greater incidence of previous vascular interventions (P = 0.05).
Table 2 describes wound characteristics and locations. Traumatic injury was the most common type of
wound etiology in both osteomyelitis and non-osteomyelitis groups (51%) followed by chronic wound and
malignant wounds (40% and 9%, respectively). Chronic wounds were defined as an established wound
despite attempts at local or surgical wound care, offloading, and medical comorbidity management past 90-
days. The foot and ankle were the most common recipient site for the ALT flaps. The distributions of ALT
thickness type across osteomyelitis as well as non-osteomyelitis groups were comparable.