
Page 25 - Read Online
P. 25
Page 6 of 10 Onishi et al. Plast Aesthet Res 2024;11:5 https://dx.doi.org/10.20517/2347-9264.2023.102
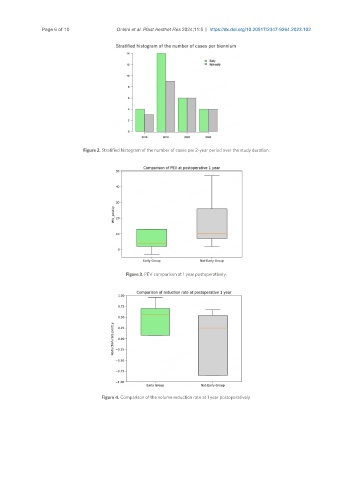
Figure 2. Stratified histogram of the number of cases per 2-year period over the study duration.
Figure 3. PEV comparison at 1 year postoperatively.
Figure 4. Comparison of the volume reduction rate at 1 year postoperatively.