
Page 24 - Read Online
P. 24
Onishi et al. Plast Aesthet Res 2024;11:5 https://dx.doi.org/10.20517/2347-9264.2023.102 Page 5 of 10
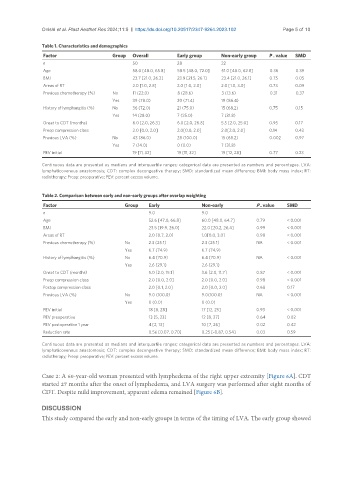
Table 1. Characteristics and demographics
Factor Group Overall Early group Non-early group P . value SMD
n 50 28 22
Age 58.0 [48.0, 65.8] 58.5 [48.0, 72.0] 51.0 [48.0, 62.8] 0.36 0.39
BMI 23.7 [21.0, 26.2] 23.9 [21.5, 26.1] 23.4 [21.0, 26.1] 0.75 0.05
Areas of RT 2.0 [1.0, 2.8] 2.0 [1.0, 2.0] 2.0 [1.0, 3.0] 0.73 0.09
Previous chemotherapy (%) No 11 (22.0) 8 (28.6) 3 (13.6) 0.31 0.37
Yes 39 (78.0) 20 (71.4) 19 (86.4)
History of lymphangitis (%) No 36 (72.0) 21 (75.0) 15 (68.2) 0.75 0.15
Yes 14 (28.0) 7 (25.0) 7 (31.8)
Onset to CDT (months) 6.0 [2.0, 26.3] 6.0 [2.0, 26.8] 5.5 [2.0, 25.0] 0.95 0.17
Preop compression class 2.0 [0.0, 2.0] 2.0[0.0, 2.0] 2.0[2.0, 2.0] 0.14 0.43
Previous LVA (%) No 43 (86.0) 28 (100.0) 15 (68.2) 0.002 0.97
Yes 7 (14.0) 0 (0.0) 7 (31.8)
PEV initial 19 [11, 32] 19 [11, 32] 19 [12, 28] 0.77 0.23
Continuous data are presented as medians and interquartile ranges; categorical data are presented as numbers and percentages. LVA:
lymphaticovenous anastomosis; CDT: complex decongestive therapy; SMD: standardized mean difference; BMI: body mass index; RT:
radiotherapy; Preop: preoperative; PEV: percent excess volume.
Table 2. Comparison between early and non-early groups after overlap weighting
Factor Group Early Non-early P . value SMD
n 9.0 9.0
Age 52.6 [47.0, 66.8] 60.0 [48.0, 64.7] 0.79 < 0.001
BMI 23.5 [19.9, 26.0] 22.0 [20.2, 26.4] 0.99 < 0.001
Areas of RT 2.0 [0.7, 2.0] 1.0[0.0, 3.0] 0.98 < 0.001
Previous chemotherapy (%) No 2.3 (25.1) 2.3 (25.1) NA < 0.001
Yes 6.7 (74.9) 6.7 (74.9)
History of lymphangitis (%) No 6.4 (70.9) 6.4 (70.9) NA < 0.001
Yes 2.6 (29.1) 2.6 (29.1)
Onset to CDT (months) 5.0 [2.0, 15.1] 3.6 [2.0, 11.7] 0.87 < 0.001
Preop compression class 2.0 [0.0, 2.0] 2.0 [0.0, 2.0] 0.98 < 0.001
Postop compression class 2.0 [0.1, 2.0] 2.0 [0.0, 2.0] 0.68 0.17
Previous LVA (%) No 9.0 (100.0) 9.0(100.0) NA < 0.001
Yes 0 (0.0) 0 (0.0)
PEV initial 18 [8, 28] 17 [12, 25] 0.93 < 0.001
PEV preoperative 13 [5, 23] 12 [8, 27] 0.64 0.02
PEV postoperative 1 year 4 [2, 13] 10 [7, 26] 0.02 0.42
Reduction rate 0.56 [0.07, 0.70] 0.25 [-0.87, 0.54] 0.03 0.59
Continuous data are presented as medians and interquartile ranges; categorical data are presented as numbers and percentages. LVA:
lymphaticovenous anastomosis; CDT: complex decongestive therapy; SMD: standardized mean difference; BMI: body mass index; RT:
radiotherapy; Preop: preoperative; PEV: percent excess volume.
Case 2: A 60-year-old woman presented with lymphedema of the right upper extremity [Figure 6A]. CDT
started 27 months after the onset of lymphedema, and LVA surgery was performed after eight months of
CDT. Despite mild improvement, apparent edema remained [Figure 6B].
DISCUSSION
This study compared the early and non-early groups in terms of the timing of LVA. The early group showed