
Page 23 - Read Online
P. 23
Page 4 of 10 Onishi et al. Plast Aesthet Res 2024;11:5 https://dx.doi.org/10.20517/2347-9264.2023.102
Figure 1. Schematic drawing of the surgical planning of LVA for upper extremity lymphedema. LVA targets the linear-visualized
lymphatic vessels or those with dermal backflow, if present. LVA: lymphaticovenous anastomosis.
To compare the two groups, the Wilcoxon rank-sum test was performed for continuous data, and the chi-
square or Fisher's exact test for categorical data. All tests were two-tailed, and statistical significance was
defined as P < 0.05. Standardized mean differences were calculated. All analyses were performed using
EZR , a graphical user interface software for R (version 3.6.3; R Foundation for Statistical Computing,
[7]
Vienna, Austria).
RESULTS
All 50 patients were clinically classified as having stage II disease. Of these, 28 patients underwent LVA
within 6 months of CDT initiation, whereas 22 patients underwent LVA > 6 months after CDT initiation
[Table 1]. The stratified number of LVA cases per 2-year period over the study duration is shown in
Figure 2.
All patients received CDT from the same trained therapist. Postoperative compression was individualized.
Preoperatively, 10 Early Group patients (36%) wore Class 0 compression garments, 2 (7%) Class 1, and 16
(57%) Class 2. Among Non-early Group, 4 (18%) used Class 0, 1 (7.1%) Class 1, and 17 (77.3%) Class 2.
Postoperatively, 6 Early Group patients (21.4%) wore Class 0, 4 (14.3%) Class 1, and 18 (64.3%) Class 2
compression. In the Non-early group postoperatively, 6 (27.3%) wore Class 0, 1 (4.5%) Class 1, and 15
(68.2%) Class 2. No significant differences were seen between the two groups both preoperatively
and postoperatively [Table 2]. The primary outcomes were postoperative PEV and the reduction rate
at 12 months. The results showed that, after applying overlap weighting, the baseline
characteristics and demographics of the treatment and control groups were balanced [Table 2]. At the 12-
month postoperative follow-up, the early treatment group had a significantly lower PEV of 4% compared
with 10% in the delayed treatment group (P = 0.02) [Figure 3]. This difference corresponds to a
medium effect size, with a standardized mean difference (SMD) of 0.42. Additionally, the early
treatment group had a significantly greater reduction rate of 56% compared to 25% in the delayed
treatment group (P = 0.03) [Figure 4]. The reduction rate difference also represented a medium effect size,
with an SMD of 0.59 [Table 2].
Representative cases
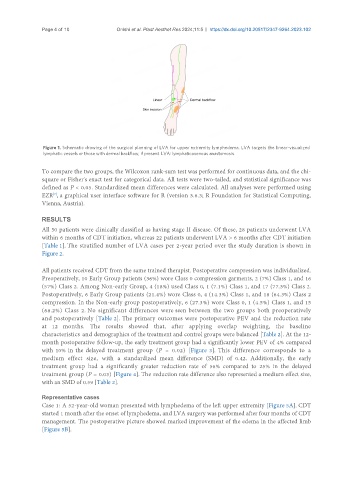
Case 1: A 52-year-old woman presented with lymphedema of the left upper extremity [Figure 5A]. CDT
started 1 month after the onset of lymphedema, and LVA surgery was performed after four months of CDT
management. The postoperative picture showed marked improvement of the edema in the affected limb
[Figure 5B].