
Page 49 - Read Online
P. 49
Valerio et al. Neuroimmunol Neuroinflammation 2021;8:42-9 I http://dx.doi.org/10.20517/2347-8659.2020.30 Page 45
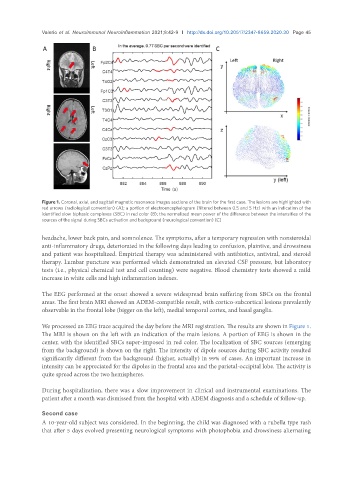
Figure 1. Coronal, axial, and sagittal magnetic resonance images sections of the brain for the first case. The lesions are highlighted with
red arrows (radiological convention) (A); a portion of electroencephalogram (filtered between 0.5 and 5 Hz) with an indication of the
identified slow biphasic complexes (SBC) in red color (B); the normalized mean power of the difference between the intensities of the
sources of the signal during SBCs activation and background (neurological convention) (C)
headache, lower back pain, and somnolence. The symptoms, after a temporary regression with nonsteroidal
anti-inflammatory drugs, deteriorated in the following days leading to confusion, plaintive, and drowsiness
and patient was hospitalized. Empirical therapy was administered with antibiotics, antiviral, and steroid
therapy. Lumbar puncture was performed which demonstrated an elevated CSF pressure, but laboratory
tests (i.e., physical chemical test and cell counting) were negative. Blood chemistry tests showed a mild
increase in white cells and high inflammation indexes.
The EEG performed at the onset showed a severe widespread brain suffering from SBCs on the frontal
areas. The first brain MRI showed an ADEM-compatible result, with cortico-subcortical lesions prevalently
observable in the frontal lobe (bigger on the left), medial temporal cortex, and basal ganglia.
We processed an EEG trace acquired the day before the MRI registration. The results are shown in Figure 1.
The MRI is shown on the left with an indication of the main lesions. A portion of EEG is shown in the
center, with the identified SBCs super-imposed in red color. The localization of SBC sources (emerging
from the background) is shown on the right. The intensity of dipole sources during SBC activity resulted
significantly different from the background (higher, actually) in 99% of cases. An important increase in
intensity can be appreciated for the dipoles in the frontal area and the parietal-occipital lobe. The activity is
quite spread across the two hemispheres.
During hospitalization, there was a slow improvement in clinical and instrumental examinations. The
patient after a month was dismissed from the hospital with ADEM diagnosis and a schedule of follow-up.
Second case
A 10-year-old subject was considered. In the beginning, the child was diagnosed with a rubella type rash
that after 5 days evolved presenting neurological symptoms with photophobia and drowsiness alternating