
Page 50 - Read Online
P. 50
Page 46 Valerio et al. Neuroimmunol Neuroinflammation 2021;8:42-9 I http://dx.doi.org/10.20517/2347-8659.2020.30
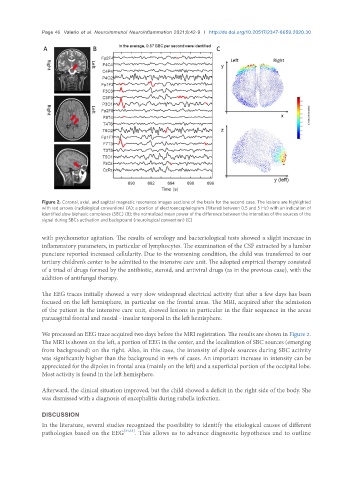
Figure 2. Coronal, axial, and sagittal magnetic resonance images sections of the brain for the second case. The lesions are highlighted
with red arrows (radiological convention) (A); a portion of electroencephalogram (filtered between 0.5 and 5 Hz) with an indication of
identified slow biphasic complexes (SBC) (B); the normalized mean power of the difference between the intensities of the sources of the
signal during SBCs activation and background (neurological convention) (C)
with psychomotor agitation. The results of serology and bacteriological tests showed a slight increase in
inflammatory parameters, in particular of lymphocytes. The examination of the CSF extracted by a lumbar
puncture reported increased cellularity. Due to the worsening condition, the child was transferred to our
tertiary children’s center to be admitted to the intensive care unit. The adopted empirical therapy consisted
of a triad of drugs formed by the antibiotic, steroid, and antiviral drugs (as in the previous case), with the
addition of antifungal therapy.
The EEG traces initially showed a very slow widespread electrical activity that after a few days has been
focused on the left hemisphere, in particular on the frontal areas. The MRI, acquired after the admission
of the patient in the intensive care unit, showed lesions in particular in the flair sequence in the areas
parasagittal frontal and mesial - insular temporal in the left hemisphere.
We processed an EEG trace acquired two days before the MRI registration. The results are shown in Figure 2.
The MRI is shown on the left, a portion of EEG in the center, and the localization of SBC sources (emerging
from background) on the right. Also, in this case, the intensity of dipole sources during SBC activity
was significantly higher than the background in 99% of cases. An important increase in intensity can be
appreciated for the dipoles in frontal area (mainly on the left) and a superficial portion of the occipital lobe.
Most activity is found in the left hemisphere.
Afterward, the clinical situation improved, but the child showed a deficit in the right side of the body. She
was dismissed with a diagnosis of encephalitis during rubella infection.
DISCUSSION
In the literature, several studies recognized the possibility to identify the etiological causes of different
pathologies based on the EEG [24,25] . This allows us to advance diagnostic hypotheses and to outline