
Page 96 - Read Online
P. 96
Page 18 of 32 Noor et al. Neuroimmunol Neuroinflammation 2019;6:10 I http://dx.doi.org/10.20517/2347-8659.2019.18
B
A
C
D
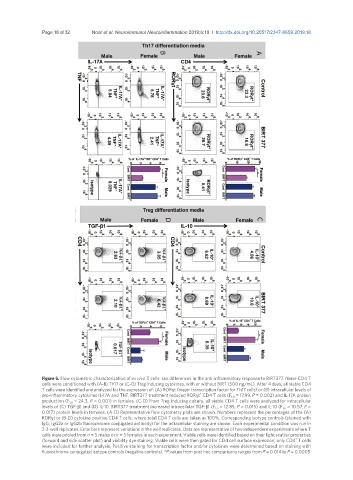
Figure 5. Flow cytometric characterization of ex vivo T cells: sex differences in the anti-inflammatory response to BIRT377. Naïve CD4 T
cells were conditioned with (A-B) Th17 or (C-D) Treg inducing cytokines, with or without BIRT (500 ng/mL). After 4 days, all viable CD4
T cells were identified and analyzed for the expression of: (A) RORɣt (major transcription factor for Th17 cells) or (B) intracellular levels of
+
pro-inflammatory cytokines IL-17A and TNF. BIRT377 treatment reduced RORɣt CD4 T cells (F 1,8 = 17.99, P = 0.002) and IL-17A protein
production (F 1,8 = 24.3, P = 0.001) in females. (C-D) From Treg inducing culture, all viable CD4 T cells were analyzed for intracellular
levels of (C) TGF-β1 and (D) IL-10. BIRT377 treatment increased intracellular TGF-β1 (F 1,5 = 12.85, P = 0.015) and IL-10 (F 1,6 = 10.57, P =
0.017) protein levels in females. (A-D) Representative flow cytometry plots are shown. Numbers represent the percentages of the (A)
RORɣt or (B-D) cytokine positive CD4 T cells, where total CD4 T cells are taken as 100%. Corresponding isotype controls (stained with
IgG, IgG2a or IgG2b fluorochrome conjugated antibody) for the intracellular staining are shown. Each experimental condition was run in
2-3-well replicates. Error bars represent variations in the well replicates. Data are representative of two independent experiments where T
cells were pooled from n = 5 males or n = 5 females in each experiment. Viable cells were identified based on their light scatter properties
+
(forward and side scatter plot) and viability dye staining. Viable cells were then gated for CD4 cell surface expression; only CD4 T cells
were included for further analysis. Positive staining for transcription factor and/or cytokines were determined based on staining with
fluorochrome conjugated isotype controls (negative controls). *P values from post hoc comparisons ranges from P = 0.014 to P = 0.0005