
Page 153 - Read Online
P. 153
Page 6 of 14 Zoghi et al. Neuroimmunol Neuroinflammation 2019;6:14 I http://dx.doi.org/10.20517/2347-8659.2019.03
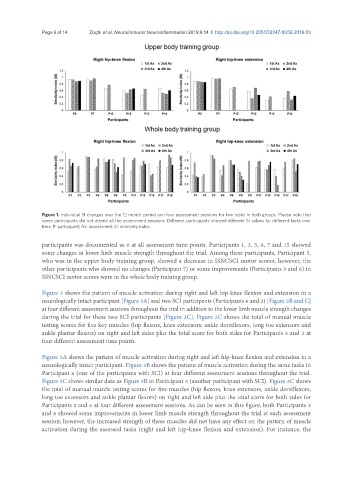
Figure 1. Individual SI changes over the 12 month-period and four assessment sessions for two tasks in both groups. Please note that
some participants did not attend all the assessment sessions. Different participants showed different SI values for different tasks over
time. P: participant; Ax: assessment; SI: similarity index
participants was documented as 0 at all assessment time points. Participants 1, 3, 5, 6, 7 and 15 showed
some changes in lower limb muscle strength throughout the trial. Among these participants, Participant 5,
who was in the upper body training group, showed a decrease in ISNCSCI motor scores; however, the
other participants who showed no changes (Participant 7) or some improvements (Participants 3 and 6) in
ISNCSCI motor scores were in the whole body training group.
Figure 3 shows the pattern of muscle activation during right and left hip-knee flexion and extension in a
neurologically intact participant [Figure 3A] and two SCI participants (Participants 6 and 3) [Figure 3B and C]
at four different assessment sessions throughout the trial in addition to the lower limb muscle strength changes
during the trial for these two SCI participants [Figure 3C]. Figure 3C shows the total of manual muscle
testing scores for five key muscles (hip flexors, knee extensors, ankle dorsiflexors, long toe extensors and
ankle plantar flexors) on right and left sides plus the total score for both sides for Participants 6 and 3 at
four different assessment time points.
Figure 3A shows the pattern of muscle activation during right and left hip-knee flexion and extension in a
neurologically intact participant. Figure 3B shows the pattern of muscle activation during the same tasks in
Participant 6 (one of the participants with SCI) at four different assessment sessions throughout the trial.
Figure 3C shows similar data as Figure 3B in Participant 3 (another participant with SCI). Figure 3C shows
the total of manual muscle testing scores for five muscles (hip flexors, knee extensors, ankle dorsiflexors,
long toe extensors and ankle plantar flexors) on right and left side plus the total score for both sides for
Participants 3 and 6 at four different assessment sessions. As can be seen in this figure, both Participants 3
and 6 showed some improvements in lower limb muscle strength throughout the trial at each assessment
session; however, the increased strength of these muscles did not have any effect on the pattern of muscle
activation during the assessed tasks (right and left hip-knee flexion and extension). For instance, the