
Page 60 - Read Online
P. 60
Alhazzani et al. Neuroimmunol Neuroinflammation 2018;5:8 I http://dx.doi.org/10.20517/2347-8659.2017.55 Page 7 of 10
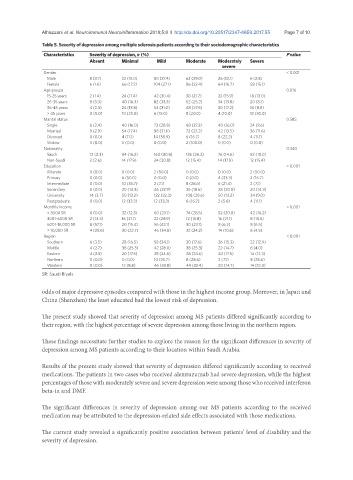
Table 5. Severity of depression among multiple sclerosis patients according to their sociodemographic characteristics
Characteristics Severity of depression, n (%) P value
Absent Minimal Mild Moderate Moderately Severe
severe
Gender < 0.001
Male 8 (3.7) 32 (15.0) 80 (37.4) 62 (29.0) 26 (12.1) 6 (2.8)
Female 6 (1.6) 66 (17.2) 104 (27.1) 86 (22.4) 64 (16.7) 58 (15.1)
Age groups 0.016
15-25 years 2 (1.4) 24 (17.4) 42 (30.4) 30 (21.7) 22 (15.9) 18 (13.0)
26-35 years 8 (3.3) 40 (16.3) 82 (33.3) 62 (25.2) 34 (13.8) 20 (8.1)
36-45 years 4 (2.3) 24 (13.8) 54 (31.0) 48 (27.6) 30 (17.2) 14 (8.0)
> 45 years 0 (0.0) 10 (25.0) 6 (15.0) 8 (20.0) 4 (10.0) 12 (30.0)
Marital status 0.585
Single 6 (2.4) 40 (16.0) 72 (28.8) 68 (27.2) 40 (16.0) 24 (9.6)
Married 8 (2.9) 54 (17.4) 98 (31.6) 72 (23.2) 42 (13.5) 36 (11.6)
Divorced 0 (0.0) 4 (11.1) 14 (38.9) 6 (16.7) 8 (22.2) 4 (11.1)
Widow 0 (0.0) 0 (0.0) 0 (0.0) 2 (100.0) 0 (0.0) 0 (0.0)
Nationality 0.340
Saudi 12 (2.3) 84 (16.2) 160 (30.8) 136 (26.2) 76 (14.6) 52 (10.0)
Non-Saudi 2 (2.6) 14 (17.9) 24 (30.8) 12 (15.4) 14 (17.9) 12 (15.4)
Education < 0.001
Illiterate 0 (0.0) 0 (0.0) 2 (50.0) 0 (0.0) 0 (0.0) 2 (50.0)
Primary 0 (0.0) 6 (50.0) 0 (0.0) 0 (0.0) 4 (33.3) 2 (16.7)
Intermediate 0 (0.0) 10 (35.7) 2 (7.1) 8 (28.6) 6 (21.4) 2 (7.1)
Secondary 0 (0.0) 20 (14.3) 46 (32.9) 26 (18.6) 28 (20.0) 20 (14.3)
University 14 (3.7) 50 (13.2) 122 (32.3) 108 (28.6) 50 (13.2) 34 (9.0)
Postgraduate 0 (0.0) 12 (33.3) 12 (33.3) 6 (16.7) 2 (5.6) 4 (11.1)
Monthly income < 0.001
< 3000 SR 0 (0.0) 32 (12.3) 60 (23.1) 74 (28.5) 52 (20.0) 42 (16.2)
3001-6000 SR 2 (14.3) 16 (21.1) 22 (28.9) 12 (15.8) 16 (21.1) 8 (10.5)
6001-10,000 SR 8 (57.1) 20 (15.4) 56 (43.1) 30 (23.1) 8 (6.2) 8 (6.5)
> 10,000 SR 4 (28.6) 30 (22.7) 46 (34.8) 32 (24.2) 14 (10.6) 6 (4.5)
Region < 0.001
Southern 6 (3.5) 28 (16.5) 58 (34.1) 30 (17.6) 26 (15.3) 22 (12.9)
Middle 4 (2.7) 38 (25.3) 42 (28.0) 38 (25.3) 22 (14.7) 6 (4.0)
Eastern 4 (3.5) 20 (17.5) 28 (24.6) 28 (24.6) 20 (17.5) 14 (12.3)
Northern 0 (0.0) 0 (0.0) 10 (35.7) 8 (28.6) 2 (7.1) 8 (28.6)
Western 0 (0.0) 12 (8.8) 46 (33.8) 44 (32.4) 20 (14.7) 14 (10.3)
SR: Saudi Riyals
odds of major depressive episodes compared with those in the highest income group. Moreover, in Japan and
China (Shenzhen) the least educated had the lowest risk of depression.
The present study showed that severity of depression among MS patients differed significantly according to
their region, with the highest percentage of severe depression among those living in the northern region.
These findings necessitate further studies to explore the reason for the significant differences in severity of
depression among MS patients according to their location within Saudi Arabia.
Results of the present study showed that severity of depression differed significantly according to received
medications. The patients in two cases who received alemtuzumab had severe depression, while the highest
percentages of those with moderately severe and severe depression were among those who received interferon
beta-1a and DMF.
The significant differences in severity of depression among our MS patients according to the received
medication may be attributed to the depression-related side effects associated with those medications.
The current study revealed a significantly positive association between patients’ level of disability and the
severity of depression.