
Page 57 - Read Online
P. 57
Page 4 of 10 Alhazzani et al. Neuroimmunol Neuroinflammation 2018;5:8 I http://dx.doi.org/10.20517/2347-8659.2017.55
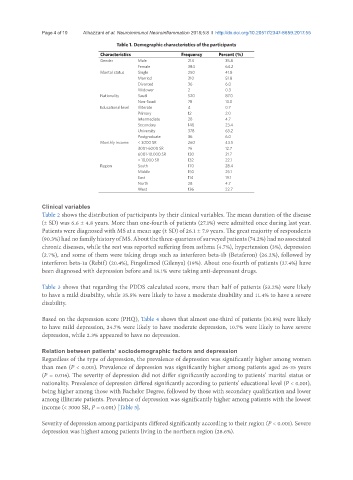
Table 1. Demographic characteristics of the participants
Characteristics Frequency Percent (%)
Gender Male 214 35.8
Female 384 64.2
Marital status Single 250 41.8
Married 310 51.8
Divorced 36 6.0
Widower 2 0.3
Nationality Saudi 520 87.0
Non-Saudi 78 13.0
Educational level Illiterate 4 0.7
Primary 12 2.0
Intermediate 28 4.7
Secondary 140 23.4
University 378 63.2
Postgraduate 36 6.0
Monthly income < 3000 SR 260 43.5
3001-6000 SR 76 12.7
6001-10,000 SR 130 21.7
> 10,000 SR 132 22.1
Region South 170 28.4
Middle 150 25.1
East 114 19.1
North 28 4.7
West 136 22.7
Clinical variables
Table 2 shows the distribution of participants by their clinical variables. The mean duration of the disease
(± SD) was 6.6 ± 4.8 years. More than one-fourth of patients (27.1%) were admitted once during last year.
Patients were diagnosed with MS at a mean age (± SD) of 26.1 ± 7.9 years. The great majority of respondents
(90.3%) had no family history of MS. About the three-quarters of surveyed patients (74.2%) had no associated
chronic diseases, while the rest was reported suffering from asthma (4.7%), hypertension (3%), depression
(2.7%), and some of them were taking drugs such as interferon beta-1b (Betaferon) (26.2%), followed by
interferon beta-1a (Rebif) (20.4%), Fingolimod (Gilenya) (19%). About one-fourth of patients (27.4%) have
been diagnosed with depression before and 18.1% were taking anti-depressant drugs.
Table 3 shows that regarding the PDDS calculated score, more than half of patients (53.2%) were likely
to have a mild disability, while 35.5% were likely to have a moderate disability and 11.4% to have a severe
disability.
Based on the depression score (PHQ), Table 4 shows that almost one-third of patients (30.8%) were likely
to have mild depression, 24.7% were likely to have moderate depression, 10.7% were likely to have severe
depression, while 2.3% appeared to have no depression.
Relation between patients’ sociodemographic factors and depression
Regardless of the type of depression, the prevalence of depression was significantly higher among women
than men (P < 0.001). Prevalence of depression was significantly higher among patients aged 26-35 years
(P = 0.016). The severity of depression did not differ significantly according to patients’ marital status or
nationality. Prevalence of depression differed significantly according to patients’ educational level (P < 0.001),
being higher among those with Bachelor Degree, followed by those with secondary qualification and lower
among illiterate patients. Prevalence of depression was significantly higher among patients with the lowest
income (< 3000 SR, P = 0.001) [Table 5].
Severity of depression among participants differed significantly according to their region (P < 0.001). Severe
depression was highest among patients living in the northern region (28.6%).