Page 31 - Read Online
P. 31

Page 12 of 19                                                                                          Son et al. Microbiome Res Rep. 2025;4:29      https://dx.doi.org/10.20517/mrr.2025.14


                                                                                                                            +
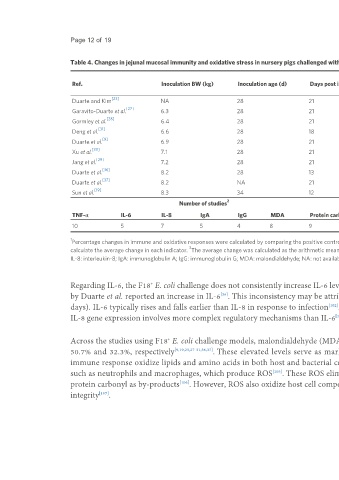
                          Table 4. Changes in jejunal mucosal immunity and oxidative stress in nursery pigs challenged with F18  E. coli
                                                                                                                                                                               1
                                                                                                                                                                         Change  (Δ%)
                          Ref.                            Inoculation BW (kg)        Inoculation age (d)      Days post inoculation (d)
                                                                                                                                               TNF-α     IL-6    IL-8    IgA     IgG    MDA      Protein carbonyl
                                        [23]                                                                                                                                                        *
                          Duarte and Kim                  NA                        28                       21                               13.9      -       -        -       -      -        36.1
                                             [27]
                          Garavito-Duarte et al.          6.3                       28                       21                               –22.3     –9.1    –2.1     –6.6    –12.1  –2.4     27.6
                                      [28]
                          Gormley et al.                  6.4                       28                       21                               –8.9      –43.2   11.5     2.9     5.4    35.3     24.2
                                    [31]                                                                                                                             *
                          Deng et al.                     6.6                       28                       18                               –8.2      –18.9   –27.3    –11.2   -      17.0     2.9
                                     [9]                                                                                                                                                             *
                          Duarte et al.                   6.9                       28                       21                               26.7      -       -        -       -      -        67.9
                                 [30]                                                                                                                                                                *
                          Xu et al.                       7.1                       28                       21                               12.5      –6.7    83.3     42.4    24.7   –1.4     47.4
                                   [29]
                          Jang et al.                     7.2                       28                       21                               42.7      -       –2.8     18.5    60.7   41.9     66.5
                                     [36]                                                                                                                   *                                *
                          Duarte et al.                   8.2                       28                       13                               10.4      45.3    3.0      -       -      215.4    7.6
                                     [37]                                                                                                                                                   *
                          Duarte et al.                   8.2                       NA                       21                               17.1      -       10.8     -       -      87.4     10.4
                                  [19]                                                                                                             *
                          Sun et al.                      8.3                       34                       12                               64.8      -       -        -       -      12.1     -
                                                                                                                                                                                    3
                                                                Number of studies 2                                                                                  Average change  (Δ%)
                          TNF-α            IL-6           IL-8         IgA           IgG        MDA           Protein carbonyl                 TNF-α     IL-6    IL-8    IgA     IgG    MDA      Protein carbonyl
                          10               5              7            5            4           8            9                                14.9      –6.5    10.9     9.2     19.7   50.7     32.3

                          1                                                                                                                                                                   2
                          Percentage changes in immune and oxidative responses were calculated by comparing the positive control (E. coli-challenged group) with the negative control (non-challenged group).  Number of studies used to
                                                                   3                                                     *
                          calculate the average change in each indicator.  The average change was calculated as the arithmetic mean.  P < 0.05. E. coli: Escherichia coli; BW: body weight; TNF-α: tumor necrosis factor-alpha; IL-6: interleukin-6;
                          IL-8: interleukin-8; IgA: immunoglobulin A; IgG: immunoglobulin G; MDA: malondialdehyde; NA: not available.


                          Regarding IL-6, the F18  E. coli challenge does not consistently increase IL-6 levels in the jejunal mucosa of pigs. Among the relevant studies                       [27,28,30,31,36] , the study
                                                      +
                          by Duarte et al. reported an increase in IL-6 . This inconsistency may be attributed to differences in the timing of post-inoculation sampling (13 vs. 18 or 21
                                                                              [36]
                          days). IL-6 typically rises and falls earlier than IL-8 in response to infection . Although both cytokines are regulated via similar pathways involving NF-κB,
                                                                                                                    [102]
                          IL-8 gene expression involves more complex regulatory mechanisms than IL-6 .
                                                                                                                       [103]


                                                            +
                          Across the studies using F18  E. coli challenge models, malondialdehyde (MDA) and protein carbonyl levels in the jejunal mucosa increased by an average of
                          50.7% and 32.3%, respectively       [9,19,23,27-31,36,37] . These elevated levels serve as markers of both host defense and oxidative damage. ROS generated during the
                          immune response oxidize lipids and amino acids in both host and bacterial cells . F18  E. coli, along with inflammatory cytokines, activates immune cells
                                                                                                                                     +
                                                                                                                           [104]
                          such as neutrophils and macrophages, which produce ROS . These ROS eliminate pathogens by oxidizing their cellular components, generating MDA and
                                                                                                 [105]
                          protein carbonyl as by-products . However, ROS also oxidize host cell components, leading to structural damage, reduced VH, and compromised intestinal
                                                                [106]
                          integrity .
                                    [107]
   26   27   28   29   30   31   32   33   34   35   36