
Page 96 - Read Online
P. 96
Longhi et al. Microbiome Res Rep 2024;3:4 https://dx.doi.org/10.20517/mrr.2023.02 Page 11 of 15
Table 2. Filtering table of the analyzed sputum samples processed with the extraction protocol involving different saponin amounts,
DNase, and bead-beating treatments to test the effect of lower detergent concentrations on estimating the bias in the Gram-
negative/Gram-positive bacteria ratio
Sequenced reads High-quality Reads retained after Homo sapiens % filtered
Sample
produced reads filtering Homo
Sputum-0.0125% 51,453 48,877 31,094 36.38%
Sputum-0.05% 34,712 33,795 31,860 5.73%
Sputum-0.1% 41,873 40,807 39,754 2.58%
Sputum-0.5% 13,420 13,056 12,774 2.16%
Sputum-1.5% 34,688 33,633 32,716 2.73%
Sputum-2% 37,528 36,418 35,249 3.21%
Sputum-NT 38,545 37,556 17,595 53.15%
NT: Untreated.
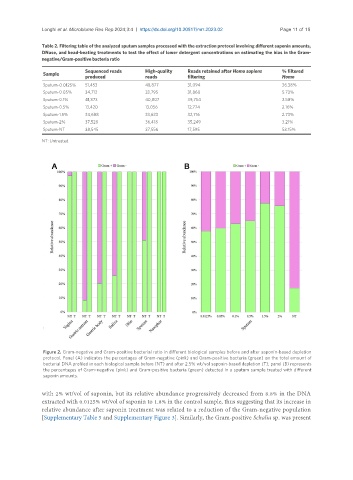
Figure 2. Gram-negative and Gram-positive bacterial ratio in different biological samples before and after saponin-based depletion
protocol. Panel (A) indicates the percentages of Gram-negative (pink) and Gram-positive bacteria (green) on the total amount of
bacterial DNA profiled in each biological sample before (NT) and after 2.5% wt/vol saponin-based depletion (T); panel (B) represents
the percentages of Gram-negative (pink) and Gram-positive bacteria (green) detected in a sputum sample treated with different
saponin amounts.
with 2% wt/vol of saponin, but its relative abundance progressively decreased from 8.8% in the DNA
extracted with 0.0125% wt/vol of saponin to 1.8% in the control sample, thus suggesting that its increase in
relative abundance after saponin treatment was related to a reduction of the Gram-negative population
[Supplementary Table 5 and Supplementary Figure 3]. Similarly, the Gram-positive Schalia sp. was present