
Page 91 - Read Online
P. 91
Page 6 of 15 Longhi et al. Microbiome Res Rep 2024;3:4 https://dx.doi.org/10.20517/mrr.2023.02
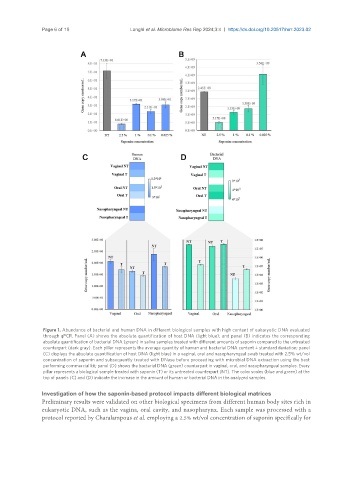
Figure 1. Abundance of bacterial and human DNA in different biological samples with high content of eukaryotic DNA evaluated
through qPCR. Panel (A) shows the absolute quantification of host DNA (light blue); and panel (B) indicates the corresponding
absolute quantification of bacterial DNA (green) in saliva samples treated with different amounts of saponin compared to the untreated
counterpart (dark gray). Each pillar represents the average quantity of human and bacterial DNA content ± standard deviation; panel
(C) displays the absolute quantification of host DNA (light blue) in a vaginal, oral and nasopharyngeal swab treated with 2.5% wt/vol
concentration of saponin and subsequently treated with DNase before proceeding with microbial DNA extraction using the best
performing commercial kit; panel (D) shows the bacterial DNA (green) counterpart in vaginal, oral, and nasopharyngeal samples. Every
pillar represents a biological sample treated with saponin (T) or its untreated counterpart (NT). The color scales (blue and green) at the
top of panels (C) and (D) indicate the increase in the amount of human or bacterial DNA in the analyzed samples.
Investigation of how the saponin-based protocol impacts different biological matrices
Preliminary results were validated on other biological specimens from different human body sites rich in
eukaryotic DNA, such as the vagina, oral cavity, and nasopharynx. Each sample was processed with a
protocol reported by Charalampous et al. employing a 2.5% wt/vol concentration of saponin specifically for