
Page 28 - Read Online
P. 28
Shirakawa et al. Mini-invasive Surg 2020;4:33 I http://dx.doi.org/10.20517/2574-1225.2020.30 Page 5 of 9
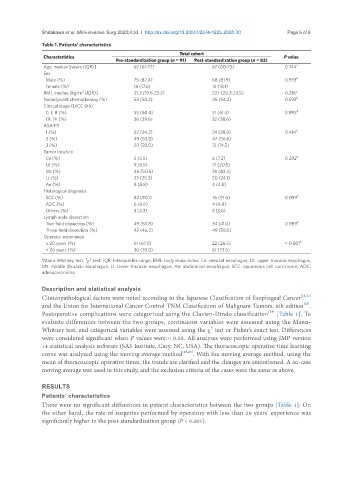
Table 1. Patients’ characteristics
Total cohort
Characteristics P value
Pre-standardization group (n = 91) Post-standardization group (n = 83)
Age, median [years (IQR)] 67 (61-72) 67 (60-73) 0.744 a
Sex
Male (%) 75 (82.4) 68 (81.9) 0.933 b
Female (%) 16 (17.6) 15 (18.1)
2
BMI, median [kg/m (IQR)] 21.3 (19.6-23.2) 22.1 (20.3-23.5) 0.216 a
Neoadjuvant chemotherapy (%) 53 (58.2) 45 (54.2) 0.592 b
Clinical stage (UICC 8th)
0, I, II (%) 55 (60.4) 51 (61.4) 0.892 b
III, IV (%) 36 (39.6) 32 (38.6)
ASA-PS
1 (%) 22 (24.2) 24 (28.9) 0.414 b
2 (%) 49 (53.8) 47 (56.6)
3 (%) 20 (22.0) 12 (14.5)
Tumor location
Ce (%) 5 (5.5) 6 (7.2) 0.292 b
Ut (%) 9 (9.9) 17 (20.5)
Mt (%) 46 (50.5) 36 (43.4)
Lt (%) 23 (25.3) 20 (24.1)
Ae (%) 8 (8.8) 4 (4.8)
Histological diagnosis
SCC (%) 82 (90.1) 76 (91.6) 0.099 b
ADC (%) 6 (6.6) 4 (4.8)
Others (%) 3 (3.3) 3 (3.6)
Lymph node dissection
Two-field dissection (%) 49 (53.8) 34 (41.0) 0.089 b
Three-field dissection (%) 42 (46.2) 49 (59.0)
Operator experience
≥ 20 years (%) 61 (67.0) 22 (26.5) < 0.001 b
< 20 years (%) 30 (33.0) 61 (73.5)
a b 2
Mann-Whitney test, χ test. IQR: interquartile range; BMI: body mass index; Ce: cervical esophagus; Ut: upper thoracic esophagus;
Mt: middle thoracic esophagus; Lt: lower thoracic esophagus; Ae: abdominal esophagus; SCC: squamous cell carcinoma; ADC:
adenocarcinoma
Description and statistical analysis
Clinicopathological factors were noted according to the Japanese Classification of Esophageal Cancer [21,22]
[23]
and the Union for International Cancer Control TNM Classification of Malignant Tumors, 8th edition .
[24]
Postoperative complications were categorized using the Clavien-Dindo classification [Table 1]. To
evaluate differences between the two groups, continuous variables were assessed using the Mann-
2
Whitney test, and categorical variables were assessed using the χ test or Fisher’s exact test. Differences
were considered significant when P values were < 0.05. All analyses were performed using JMP version
14 statistical analysis software (SAS Institute, Cary, NC, USA). The thoracoscopic operative time learning
curve was analyzed using the moving average method [25,26] . With the moving average method, using the
mean of thoracoscopic operative times, the trends are clarified and the changes are smoothened. A 20-case
moving average was used in this study, and the exclusion criteria of the cases were the same as above.
RESULTS
Patients’ characteristics
There were no significant differences in patient characteristics between the two groups [Table 1]. On
the other hand, the rate of surgeries performed by operators with less than 20 years’ experience was
significantly higher in the post-standardization group (P < 0.001).