
Page 28 - Read Online
P. 28
Page 6 of 10 Nishimura et al. Mini-invasive Surg 2020;4:11 I http://dx.doi.org/10.20517/2574-1225.2019.48
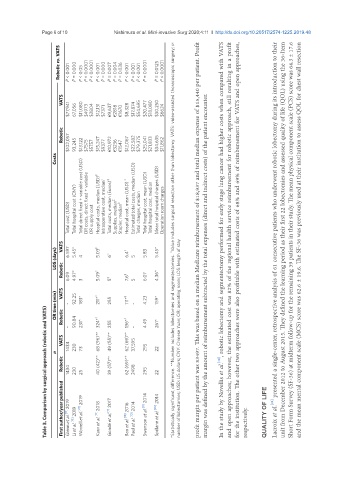
Robotic vs. VATS P < 0.001 P = 0.000 P < 0.05 P < 0.0001 P < 0.0001 P < 0.001 P = 0.000 P = 0.007 P = 0.004 P = 0.036 P < 0.001 P < 0.001 P < 0.001 P = 0.0001 P = 0.0125 P < 0.0001
VATS
$77,941 67,056 $11,080 $4973 $2804 $12,131 $7371 €9,637 €2818 €1670 $8,328 $17,874 $54,695 $20,477 $18,080 $30,250 $6624
Robotic $102,057 93,245 $13,122 $7575 $5757 $15,247 $9377 €10,972 €3236 €1547 $12,067 $22,582 $79,375 $25,041 $21,833 $34,635 $11,862
Costs
Total cost (USD) Total hospital cost (CNY) Total direct fixed + variable cost (USD) OR costs, direct fixed + variable OR supply cost Hospital costs, median (USD) ‡ Intraoperative cost, median ‡ Total costs, median (Euros) ‡ Supplies, median ‡ Stapler, median ‡ Hospital cost, mean (USD) ‡ Estimated total costs, median (USD) Total charges, median Total hospital cost, mean (USD) Total hospital cost, median Mean total hospital charges (USD)
VATS 6.597 5.45* 5.03 ‡ 5.45* *Statistically significant difference. **Number includes lobectomies and segmentectomies. ‡ Value includes surgical resection other than lobectomy. VATS: video-assisted thoracoscopic surgery; n: profit margin per patient was $3497. This was based on a median Medicare reimbursement of $18,937 and total median expense of $15,440 per patient. Profit In the study by Novellis et al. [14] , robotic lobectomy and seg
LOS (days) 4 6 ‡ 6.4 ‡ 5 5.83
Robotic 6.09 4.97* 3 5.09 ‡ 5 ‡ 7.6 ‡ 5 6.07 4.36* margin was defined by the amount of reimbursement subtracted by the total expenses (direct and indirect costs) of the patient encounter.
OR time (min) VATS - 92.25 183* 211* ‡ 255 111* ‡ - 4.23 159*
Table 3. Comparison by surgical approach (robotic and VATS)
- Robotic 90.84 231* 324* ‡ 255 136* ‡ - 4.49 261*
VATS 1434 68 (96)** 49 (55)** 62 (69)** 37,595 number of lobectomies; USD: US dollars; CNY: Chinese Yuan; OR: operating room; LOS: length of stay
n 230 73 295 22
Robotic 1434 230 25 40 (42)** 39 (57)** 62 (69)** 2498 295 22
First author/year published Glenn et al. [8] 2019 Li et al. [19] 2019 Worrell et al. [21] 2019 Kaur et al. [11] 2018 Gondé et al. [7] 2017 Bao et al. [18] 2016 Paul et al. [10] 2014 Swanson et al. [9] 2014 Spillane et al. [20] 2014 respectively. QUALITY OF LIFE