
Page 45 - Read Online
P. 45
Page 6 of 15 Dasgupta et al. J Transl Genet Genom 2018;2:15. I https://doi.org/10.20517/jtgg.2018.21
A B
C D
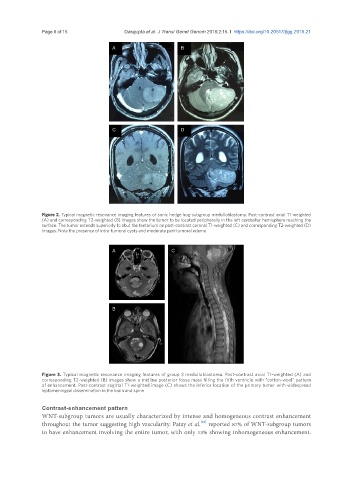
Figure 2. Typical magnetic resonance imaging features of sonic hedge hog-subgroup medulloblastoma. Post-contrast axial T1-weighted
(A) and corresponding T2-weighted (B) images show the tumor to be located peripherally in the left cerebellar hemisphere reaching the
surface. The tumor extends superiorly to abut the tentorium on post-contrast coronal T1-weighted (C) and corresponding T2-weighted (D)
images. Note the presence of intra-tumoral cysts and moderate peri-tumoral edema
A C
B
Figure 3. Typical magnetic resonance imaging features of group 3 medulloblastoma. Post-contrast axial T1-weighted (A) and
corresponding T2-weighted (B) images show a midline posterior fossa mass filling the IVth ventricle with “cotton-wool” pattern
of enhancement. Post-contrast sagittal T1-weighted image (C) shows the inferior location of the primary tumor with widespread
leptomeningeal dissemination in the brain and spine
Contrast-enhancement pattern
WNT-subgroup tumors are usually characterized by intense and homogeneous contrast enhancement
[26]
throughout the tumor suggesting high vascularity. Patay et al. reported 87% of WNT-subgroup tumors
to have enhancement involving the entire tumor, with only 13% showing inhomogeneous enhancement.