
Page 113 - Read Online
P. 113
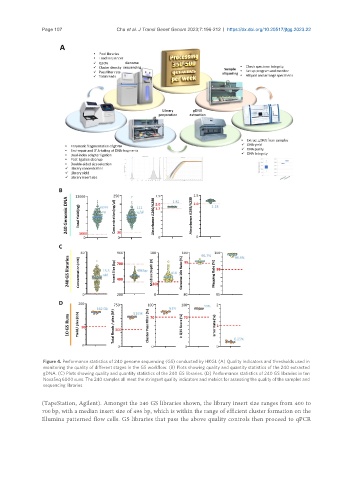
Page 107                 Chu et al. J Transl Genet Genom 2023;7:196-212  https://dx.doi.org/10.20517/jtgg.2023.22


                Figure 4. Performance statistics of 240 genome sequencing (GS) conducted by HKGI. (A) Quality indicators and thresholds used in
                monitoring the quality of different stages in the GS workflow. (B) Plots showing quality and quantity statistics of the 240 extracted
                gDNA. (C) Plots showing quality and quantity statistics of the 240 GS libraries. (D) Performance statistics of 240 GS libraries in ten
                NovaSeq 6000 runs. The 240 samples all meet the stringent quality indicators and metrics for assessing the quality of the samples and
                sequencing libraries.

               (TapeStation, Agilent). Amongst the 240 GS libraries shown, the library insert size ranges from 400 to
               700 bp, with a median insert size of 496 bp, which is within the range of efficient cluster formation on the
               Illumina patterned flow cells. GS libraries that pass the above quality controls then proceed to qPCR