
Page 111 - Read Online
P. 111
Page 105 Chu et al. J Transl Genet Genom 2023;7:196-212 https://dx.doi.org/10.20517/jtgg.2023.22
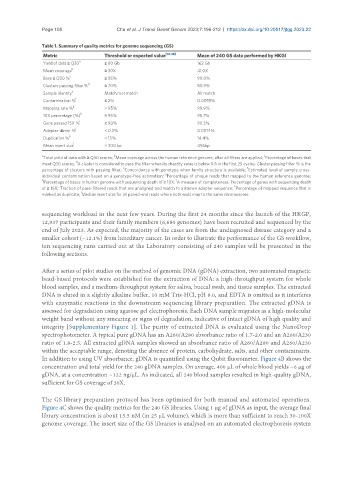
Table 1. Summary of quality metrics for genome sequencing (GS)
Metric Threshold or expected value [45,48] Mean of 240 GS data performed by HKGI
Yield of data ≥ Q30 a ≥ 80 Gb 162 Gb
b
Mean coverage ≥ 30X 41.0X
c
Base ≥ Q30 % ≥ 85% 90.0%
Clusters passing filter % d ≥ 70% 80.9%
e
Sample identity Match/not match All match
Contamination % f ≤ 2% 0.0055%
Mapping rate % g > 95% 99.9%
h
10X percentage (%) ≥ 95% 95.7%
Gene passed 15X % i ≥ 90% 99.3%
j
Adapter-dimer % < 0.2% 0.0014%
Duplication % k < 15% 14.4%
l
Mean insert size > 300 bp 496bp
a b c
Total yield of data with ≥ Q30 scores; Mean coverage across the human reference genome, after all filters are applied; Percentage of bases that
d
meet Q30 scores; A cluster is considered to pass the filter when its chastity value is below 0.6 in the first 25 cycles. Cluster passing filter % is the
e f
percentage of clusters with passing filter; Concordance with genotype when family structure is available; Estimated level of sample cross-
g
individual contamination based on a genotype-free estimation; Percentage of unique reads that mapped to the human reference genome;
h i
Percentage of bases in human genome with sequencing depth of ≥ 10X; A measure of completeness. Percentage of genes with sequencing depth
j k
of ≥ 15X; Fraction of pass-filtered reads that are unaligned and match to a known adapter sequence; Percentage of mapped sequence that is
l
marked as duplicate; Median insert size for all paired-end reads where both ends map to the same chromosome.
sequencing workload in the next few years. During the first 24 months since the launch of the HKGP,
12,937 participants and their family members (6,680 genomes) have been recruited and sequenced by the
end of July 2023. As expected, the majority of the cases are from the undiagnosed disease category and a
smaller cohort (~12.1%) from hereditary cancer. In order to illustrate the performance of the GS workflow,
ten sequencing runs carried out at the Laboratory consisting of 240 samples will be presented in the
following sections.
After a series of pilot studies on the method of genomic DNA (gDNA) extraction, two automated magnetic
bead-based protocols were established for the extraction of DNA: a high-throughput system for whole
blood samples, and a medium-throughput system for saliva, buccal swab, and tissue samples. The extracted
DNA is eluted in a slightly alkaline buffer, 10 mM Tris-HCl, pH 8.0, and EDTA is omitted as it interferes
with enzymatic reactions in the downstream sequencing library preparation. The extracted gDNA is
assessed for degradation using agarose gel electrophoresis. Each DNA sample migrates as a high-molecular
weight band without any smearing or signs of degradation, indicative of intact gDNA of high quality and
integrity [Supplementary Figure 1]. The purity of extracted DNA is evaluated using the NanoDrop
spectrophotometer. A typical pure gDNA has an A260/A280 absorbance ratio of 1.7-2.0 and an A260/A230
ratio of 1.8-2.5. All extracted gDNA samples showed an absorbance ratio of A260/A280 and A260/A230
within the acceptable range, denoting the absence of protein, carbohydrate, salts, and other contaminants.
In addition to using UV absorbance, gDNA is quantified using the Qubit fluorometer. Figure 4B shows the
concentration and total yield for the 240 gDNA samples. On average, 400 µL of whole blood yields ~6 µg of
gDNA, at a concentration ~122 ng/µL. As indicated, all 240 blood samples resulted in high-quality gDNA,
sufficient for GS coverage of 30X.
The GS library preparation protocol has been optimised for both manual and automated operations.
Figure 4C shows the quality metrics for the 240 GS libraries. Using 1 µg of gDNA as input, the average final
library concentration is about 15.5 nM (in 25 µL volume), which is more than sufficient to reach 30-100X
genome coverage. The insert size of the GS libraries is analysed on an automated electrophoresis system