


Page 46 - Read Online
P. 46
Li et al. J. Mater. Inf. 2025, 5, 21  https://dx.doi.org/10.20517/jmi.2024.87   Page 11 of 15


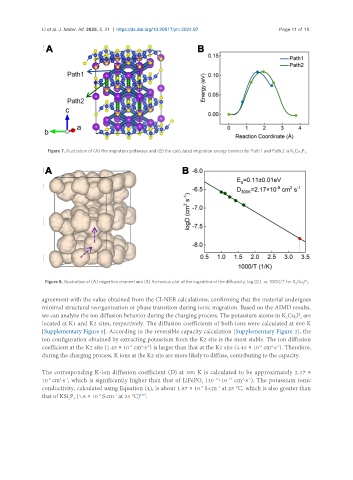
                 Figure 7. Illustration of (A) the migration pathways and (B) the calculated migration energy barriers for Path 1 and Path 2 in K Cu P .
                                                                                                    3  3 2


                Figure 8. Illustration of (A) migration channel and (B) Arrhenius plot of the logarithm of the diffusivity, log (D), vs. 1000/T for K Cu P .
                                                                                                     3
                                                                                                       3 2
               agreement with the value obtained from the CI-NEB calculations, confirming that the material undergoes
               minimal structural reorganization or phase transition during ionic migration. Based on the AIMD results,
               we can analyze the ion diffusion behavior during the charging process. The potassium atoms in K Cu P  are
                                                                                                 3
                                                                                                    3 2
               located at K1 and K2 sites, respectively. The diffusion coefficients of both ions were calculated at 600 K
               [Supplementary Figure 5]. According to the reversible capacity calculation [Supplementary Figure 2], the
               ion configuration obtained by extracting potassium from the K2 site is the most stable. The ion diffusion
               coefficient at the K2 site (1.43 × 10  cm ·s ) is larger than that at the K1 site (4.45 × 10  cm ·s ). Therefore,
                                             -7
                                                 2 -1
                                                                                            2 -1
                                                                                        -8
               during the charging process, K ions at the K2 site are more likely to diffuse, contributing to the capacity.
               The corresponding K-ion diffusion coefficient (D) at 300 K is calculated to be approximately 2.17 ×
               10  cm ·s , which is significantly higher than that of LiFePO  (10 -10  cm ·s ). The potassium ionic
                                                                         -14
                 -8
                                                                              -15
                     2 -1
                                                                                   2 -1
                                                                     4
               conductivity, calculated using Equation (4), is about 1.87 × 10  S·cm  at 25 °C, which is also greater than
                                                                    -3
                                                                          -1
               that of KSi P  (1.6 × 10  S·cm  at 25 °C) .
                                       -1
                                  -4
                                                [39]
                        2 3

