


Page 186 - Read Online
P. 186
Hei et al. J. Mater. Inf. 2026, 6, 15                                            Page 11 of 22


               matching. This step is crucial for determining whether the output tuples accurately convey the intended
               scientific meaning, as any erroneous entity allocation by the model could distort the semantic content of the
               tuples. It is important to note that we do not directly predict the relationships between captured entities;
               rather, we determine whether two entities should reside within the same tuple. This approach is justified for
               two reasons: first, the number of relationships between entities in materials literature is fixed and limited
               once the types of entities to be extracted are identified, rendering relationship prediction less beneficial for
               extracting correct tuples. Second, predicting relationships between entities constitutes a multi-class
               classification task, whereas entity matching is a binary classification task, making the latter less prone to
               errors. In this stage, the five types of entities mentioned previously are extracted for subsequent assignment
               to the correct tuples.

               Performances of entity extraction
               We evaluate entity extraction across five types: MATERIAL, PROPERTY, PROPERTY VALUE,
               CONDITION, and CONDITION VALUE. Metrics are computed per entity type, reporting precision (P),
               recall (R), and F1 independently so that performance on rarer categories is visible rather than averaged out.
               We also report total metrics per dataset, where the denominators of total precision and total recall equal the
               full count of all entities in the set. This yields an overall score that reflects extraction effectiveness under the
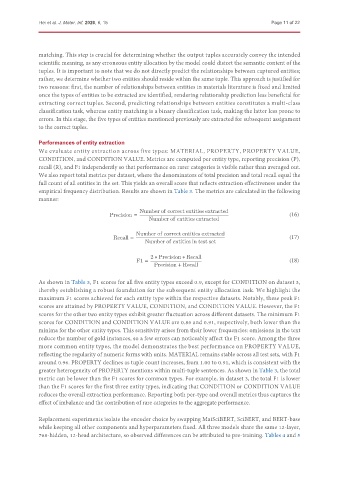
               empirical frequency distribution. Results are shown in Table 3. The metrics are calculated in the following
               manner:

                                                  Number of correct extities extracted
                                        Precision =                                                    (16)
                                                     Number of entities extracted

                                                 Number of correct entities extracted
                                         Recall =                                                      (17)
                                                    Number of entities in test set

                                                      2 ∗ Precision ∗ Recall
                                                 F1 =                                                  (18)
                                                       Precision + Recall

               As shown in Table 3, F1 scores for all five entity types exceed 0.9, except for CONDITION on dataset 3,
               thereby establishing a robust foundation for the subsequent entity allocation task. We highlight the
               maximum F1 scores achieved for each entity type within the respective datasets. Notably, these peak F1
               scores are attained by PROPERTY VALUE, CONDITION, and CONDITION VALUE. However, the F1
               scores for the other two entity types exhibit greater fluctuation across different datasets. The minimum F1
               scores for CONDITION and CONDITION VALUE are 0.86 and 0.91, respectively, both lower than the
               minima for the other entity types. This sensitivity arises from their lower frequencies: omissions in the text
               reduce the number of gold instances, so a few errors can noticeably affect the F1 score. Among the three
               more common entity types, the model demonstrates the best performance on PROPERTY VALUE,
               reflecting the regularity of numeric forms with units. MATERIAL remains stable across all test sets, with F1
               around 0.96. PROPERTY declines as tuple count increases, from 1.00 to 0.91, which is consistent with the
               greater heterogeneity of PROPERTY mentions within multi-tuple sentences. As shown in Table 3, the total
               metric can be lower than the F1 scores for common types. For example, in dataset 3, the total F1 is lower
               than the F1 scores for the first three entity types, indicating that CONDITION or CONDITION VALUE
               reduces the overall extraction performance. Reporting both per-type and overall metrics thus captures the
               effect of imbalance and the contribution of rare categories to the aggregate performance.


               Replacement experiments isolate the encoder choice by swapping MatSciBERT, SciBERT, and BERT-base
               while keeping all other components and hyperparameters fixed. All three models share the same 12-layer,
               768-hidden, 12-head architecture, so observed differences can be attributed to pre-training. Tables 4 and 5

