


Page 74 - Read Online
P. 74
Wu et al. J. Mater. Inf. 2025, 5, 14  https://dx.doi.org/10.20517/jmi.2024.77   Page 11 of 15


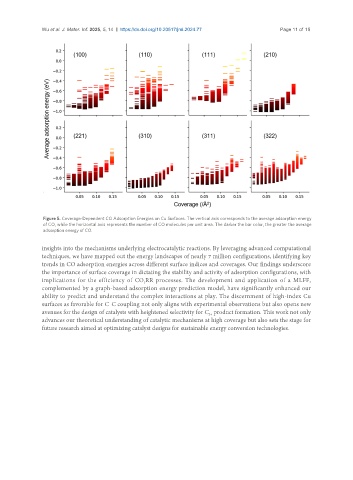
                Figure 5. Coverage-Dependent CO Adsorption Energies on Cu Surfaces. The vertical axis corresponds to the average adsorption energy
                of CO, while the horizontal axis represents the number of CO molecules per unit area. The darker the bar color, the greater the average
                adsorption energy of CO.

               insights into the mechanisms underlying electrocatalytic reactions. By leveraging advanced computational
               techniques, we have mapped out the energy landscapes of nearly 7 million configurations, identifying key
               trends in CO adsorption energies across different surface indices and coverages. Our findings underscore
               the importance of surface coverage in dictating the stability and activity of adsorption configurations, with
               implications for the efficiency of CO RR processes. The development and application of a MLFF,
                                                 2
               complemented by a graph-based adsorption energy prediction model, have significantly enhanced our
               ability to predict and understand the complex interactions at play. The discernment of high-index Cu
               surfaces as favorable for C–C coupling not only aligns with experimental observations but also opens new
               avenues for the design of catalysts with heightened selectivity for C  product formation. This work not only
                                                                       2+
               advances our theoretical understanding of catalytic mechanisms at high coverage but also sets the stage for
               future research aimed at optimizing catalyst designs for sustainable energy conversion technologies.

