


Page 35 - Read Online
P. 35
Page 8 of 16                            Lu et al. J Mater Inf 2024;4:31  https://dx.doi.org/10.20517/jmi.2024.65


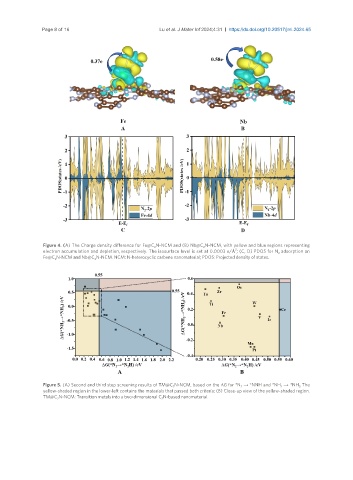
                Figure 4. (A) The Charge density difference for Fe@C N-NCM and (B) Nb@C N-NCM, with yellow and blue regions representing
                                                     2                2
                                                                                3
                electron accumulation and depletion, respectively. The isosurface level is set at 0.0003 e/Å ; (C, D) PDOS for N  adsorption on
                                                                                               2
                Fe@C N-NCM and Nb@C N-NCM. NCM: N-heterocyclic carbene nanomaterial; PDOS: Projected density of states.
                   2             2


                Figure 5. (A) Second and third step screening results of TM@C N-NCM, based on the ΔG for *N  → *NNH and *NH  →  *NH . The
                                                           2                      2             2     3
                yellow-shaded region in the lower-left contains the materials that passed both criteria; (B) Close-up view of the yellow-shaded region.
                TM@C N-NCM: Transition metals into a two-dimensional C N-based nanomaterial.
                    2                                   2

