
Page 87 - Read Online
P. 87
Chi et al. J. Mater. Inf. 2025, 5, 11 https://dx.doi.org/10.20517/jmi.2024.49 Page 3 of 12
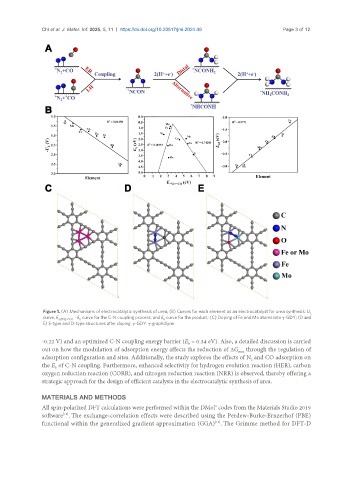
Figure 1. (A) Mechanisms of electrocatalytic synthesis of urea; (B) Curves for each element as an electrocatalyst for urea synthesis: U L
curve, E ad*N2+*CO - E curve for the C-N coupling process, and E curve for the product; (C) Doping of Fe and Mo atoms into γ-GDY; (D and
b
b
E) S-type and D-type structures after doping. γ-GDY: γ-graphdiyne.
-0.22 V) and an optimized C-N coupling energy barrier (E = 0.34 eV). Also, a detailed discussion is carried
b
out on how the modulation of adsorption energy affects the reduction of ΔG through the regulation of
max
adsorption configuration and sites. Additionally, the study explores the effects of N and CO adsorption on
2
the E of C-N coupling. Furthermore, enhanced selectivity for hydrogen evolution reaction (HER), carbon
b
oxygen reduction reaction (CORR), and nitrogen reduction reaction (NRR) is observed, thereby offering a
strategic approach for the design of efficient catalysts in the electrocatalytic synthesis of urea.
MATERIALS AND METHODS
All spin-polarized DFT calculations were performed within the DMol codes from the Materials Studio 2019
3
software . The exchange-correlation effects were described using the Perdew-Burke-Ernzerhof (PBE)
[18]
functional within the generalized gradient approximation (GGA) . The Grimme method for DFT-D
[19]