
Page 103 - Read Online
P. 103
Wu et al. J. Mater. Inf. 2025, 5, 15 https://dx.doi.org/10.20517/jmi.2024.67 Page 7 of 15
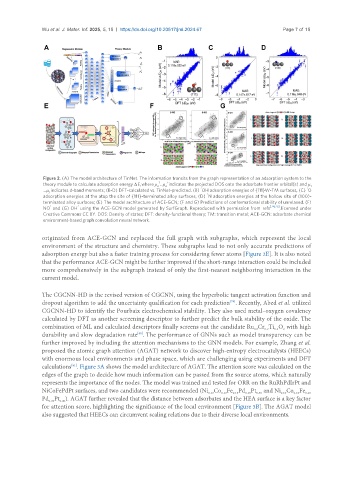
Figure 2. (A) The model architecture of TinNet. The information transits from the graph representation of an adsorption system to the
i
1
theory module to calculate adsorption energy ΔE, where ρ …ρ indicates the projected DOS onto the adsorbate frontier orbital(s) and μ 1
a
a
*
*
…μ indicates d-band moments; (B-D) DFT-calculated vs. TinNet-predicted. (B) OH adsorption energies of {111}W-TM surfaces, (C) O
j
*
adsorption energies at the atop the site of {111}-terminated alloy surfaces, (D) N adsorption energies at the hollow site of (100)-
terminated alloy surfaces; (E) The model architecture of ACE-GCN; (F and G) Predictions of conformational stability of unrelaxed. (F)
*
*
NO and (G) OH using the ACE-GCN model generated by SurfGraph. Reproduced with permission from refs [74,75] , licensed under
Creative Commons CC BY. DOS: Density of states; DFT: density-functional theory; TM: transition metal; ACE-GCN: adsorbate chemical
environment-based graph convolution neural network.
originated from ACE-GCN and replaced the full graph with subgraphs, which represent the local
environment of the structure and chemistry. These subgraphs lead to not only accurate predictions of
adsorption energy but also a faster training process for considering fewer atoms [Figure 2E]. It is also noted
that the performance ACE-GCN might be further improved if the short-range interaction could be included
more comprehensively in the subgraph instead of only the first-nearest neighboring interaction in the
current model.
The CGCNN-HD is the revised version of CGCNN, using the hyperbolic tangent activation function and
[79]
dropout algorithm to add the uncertainty qualification for each prediction . Recently, Abed et al. utilized
CGCNN-HD to identify the Pourbaix electrochemical stability. They also used metal−oxygen covalency
calculated by DFT as another screening descriptor to further predict the bulk stability of the oxide. The
combination of ML and calculated descriptors finally screens out the candidate Ru Cr Ti O with high
0.6
0.2
2
0.2
durability and slow degradation rate . The performance of GNNs such as model transparency can be
[80]
further improved by including the attention mechanisms to the GNN models. For example, Zhang et al.
proposed the atomic graph attention (AGAT) network to discover high-entropy electrocatalysts (HEECs)
with enormous local environments and phase space, which are challenging using experiments and DFT
[81]
calculations . Figure 3A shows the model architecture of AGAT. The attention score was calculated on the
edges of the graph to decide how much information can be passed from the source atoms, which naturally
represents the importance of the nodes. The model was trained and tested for ORR on the RuRhPdIrPt and
NiCoFePdPt surfaces, and two candidates were recommended (Ni Co Fe Pd Pt and Ni Co Fe 0.10
0.10
0.50
0.10
0.13
0.10
0.13
0.13
Pd Pt ). AGAT further revealed that the distance between adsorbates and the HEA surface is a key factor
0.30
0.40
for attention score, highlighting the significance of the local environment [Figure 3B]. The AGAT model
also suggested that HEECs can circumvent scaling relations due to their diverse local environments.