
Page 67 - Read Online
P. 67
Hu et al. J Mater Inf 2023;3:1 I http://dx.doi.org/10.20517/jmi.2022.28 Page 7 of 15
2
10
]
2 B 3
k 10
A
2 A
m
/
A 4
3 A 10
[
c
R 5
10
6
10
4 3 2 1 0
H [ AA /k B ]
mix
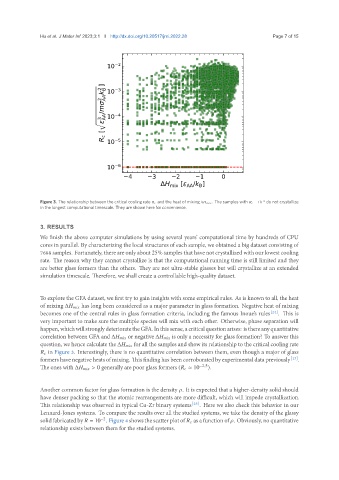
Figure 3. The relationship between the critical cooling rate and the heat of mixing Δ . The samples with = 10 −6 do not crystallize
in the longest computational timescale. They are shown here for convenience.
3. RESULTS
We finish the above computer simulations by using several years’ computational time by hundreds of CPU
cores in parallel. By characterizing the local structures of each sample, we obtained a big dataset consisting of
7688 samples. Fortunately, there are only about 25% samples that have not crystallized with our lowest cooling
rate. The reason why they cannot crystallize is that the computational running time is still limited and they
are better glass formers than the others. They are not ultra-stable glasses but will crystallize at an extended
simulation timescale. Therefore, we shall create a controllable high-quality dataset.
To explore the GFA dataset, we first try to gain insights with some empirical rules. As is known to all, the heat
of mixing Δ has long been considered as a major parameter in glass formation. Negative heat of mixing
becomes one of the central rules in glass formation criteria, including the famous Inoue’s rules [24] . This is
very important to make sure the multiple species will mix with each other. Otherwise, phase separation will
happen,whichwillstronglydeterioratetheGFA.Inthissense,acriticalquestionarises: isthereanyquantitative
correlation between GFA and Δ or negative Δ is only a necessity for glass formation? To answer this
question, we hence calculate the Δ for all the samples and show its relationship to the critical cooling rate
in Figure 3. Interestingly, there is no quantitative correlation between them, even though a major of glass
formers have negative heats of mixing. This finding has been corroborated by experimental data previously [13] .
The ones with Δ > 0 generally are poor glass formers ( ≈ 10 −2.5 ).
Another common factor for glass formation is the density . It is expected that a higher-density solid should
have denser packing so that the atomic rearrangements are more difficult, which will impede crystallization.
This relationship was observed in typical Cu-Zr binary systems [25] . Here we also check this behavior in our
Lennard-Jones systems. To compare the results over all the studied systems, we take the density of the glassy
solid fabricated by = 10 . Figure 4 shows the scatter plot of as a function of . Obviously, no quantitative
−2
relationship exists between them for the studied systems.