
Page 456 - Read Online
P. 456
Page 8 of 40 Maner et al. J Cancer Metastasis Treat 2020;6:37 I http://dx.doi.org/10.20517/2394-4722.2020.60
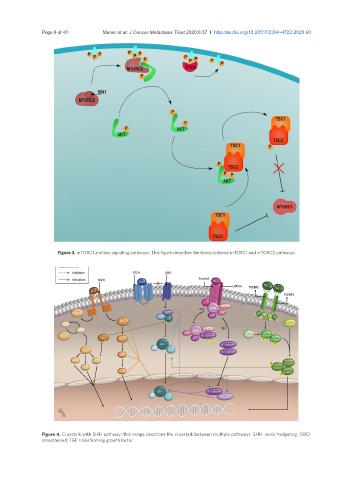
Figure 3. mTORC1 and two signaling pathways. This figure describes the transcriptional mTORC1 and mTORC2 pathways
Figure 4. Crosstalk with SHH pathway: this image describes the crosstalk between multiple pathways. SHH: sonic hedgehog; SMO:
smoothened; TGF: transforming growth factor