
Page 210 - Read Online
P. 210
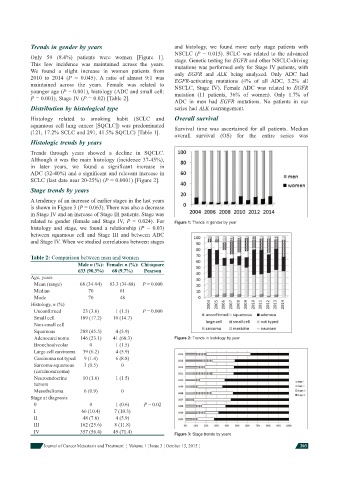
Trends in gender by years                         and  histology,  we  found  more  early  stage  patients  with
                                                              NSCLC  (P  =  0.015).  SCLC  was  related  to  the  advanced
            Only  59  (8.4%)  patients  were  women  [Figure  1].   stage. Genetic testing for EGFR and other NSCLC-driving
            This  low  incidence  was  maintained  across  the  years.   mutations was performed only for Stage IV patients, with
            We  found  a  slight  increase  in  women  patients  from   only  EGFR  and  ALK  being  analyzed.  Only  ADC  had
            2010  to  2014  (P  =  0.045).  A  ratio  of  almost  9:1  was   EGFR-activating  mutations  (4%  of  all  ADC,  3.2%  all
            maintained  across  the  years.   Female  was  related  to   NSCLC,  Stage  IV).  Female  ADC  was  related  to  EGFR
            younger age (P = 0.001), histology (ADC and small cell:   mutation  (11  patients,  36%  of  women).  Only  1.7%  of
            P = 0.001), Stage IV (P = 0.02) [Table 2].
                                                              ADC  in  men  had  EGFR  mutations.  No  patients  in  our
            Distribution by histological type                 series had ALK rearrangement.
            Histology  related  to  smoking  habit  (SCLC  and   Overall survival
                squamous cell lung cancer [SQCLC]) was predominated   Survival  time  was  ascertained  for  all  patients.  Median
            (121, 17.2% SCLC and 291, 41.5% SQCLC) [Table 1].
                                                              overall  survival  (OS)  for  the  entire  series  was
            Histologic trends by years

            Trends  through  years  showed  a  decline  in  SQCLC.
            Although it was the main histology (incidence 37-45%),
            in  later  years,  we  found  a  signifi cant  increase  in
                ADC (32-40%) and a signifi cant and relevant increase in
            SCLC (last date near 20-25%) (P = 0.0001) [Figure 2].
            Stage trends by years
            A tendency of an increase of earlier stages in the last years
            is shown in Figure 3 (P = 0.063). There was also a decrease
            in Stage IV and an increase of Stage III patients. Stage was
            related  to  gender  (female  and  Stage  IV, P  =  0.024).  For   Figure 1: Trends in gender by year
            histology  and  stage,  we  found  a  relationship  (P  =  0.03)
            between  squamous  cell  and  Stage  III  and  between ADC
            and Stage IV. When we studied correlations between stages


            Table 2: Comparison between men and women
                            Male n (%):  Female: n (%):  Chi-square
                            633 (90.3%)  68 (9.7%)  Pearson
            Age, years
             Mean (range)    68 (34-94)  63.3 (34-88)  P = 0.000
             Median             70         61
             Mode               70         48
            Histology, n (%)
             Unconfi rmed      23 (3.6)    1 (1.5)  P = 0.000
             Small cell      109 (17.2)  10 (14.7)
             Non-small cell
             Squamous        288 (45.5)   4 (5.9)
             Adenocarcinoma  146 (23.1)  41 (60.3)            Figure 2: Trends in histology by year
             Bronchoalveolar    0         1 (1.5)
             Large cell carcinoma  39 (6.2)  4 (5.9)
             Carcinoma not typed  9 (1.4)  6 (8.8)
             Sarcoma-squamous   3 (0.5)     0
             (carcinosarcoma)
             Neuroendocrine   10 (1.6)    1 (1.5)
             tumors
             Mesothelioma      6 (0.9)      0
            Stage at diagnosis
             0                   0        1 (0.6)   P = 0.02
             I                66 (10.4)  7 (10.3)
             II               48 (7.6)    4 (5.9)
             III             162 (25.6)  8 (11.8)
             IV              357 (56.4)  49 (71.4)
                                                              Figure 3: Stage trends by years
                Journal of Cancer Metastasis and Treatment  ¦  Volume 1 ¦ Issue 3 ¦ October 15, 2015 ¦    203