
Page 80 - Read Online
P. 80
Skorupan et al. J Cancer Metastasis Treat 2023;9:5 https://dx.doi.org/10.20517/2394-4722.2022.106 Page 9 of 26
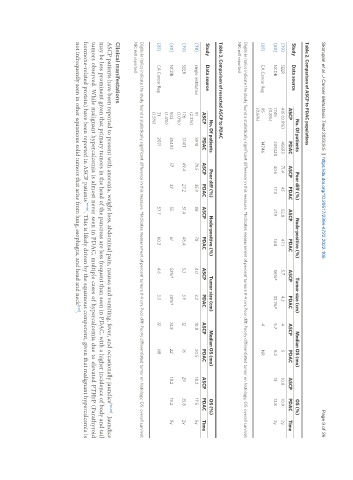
Table 2. Comparison of ASCP to PDAC populations
No. Of patients Poor diff (%) Node-positive (%) Tumor size (cm) Median OS (mo) OS (%)
Study Data source
ASCP PDAC ASCP PDAC ASCP PDAC ASCP PDAC ASCP PDAC ASCP PDAC Time
[79] SEER 415 (0.9%) 45693 71.4 45 52.8 47.1 5.7 4.3 4 5 10.8 10.9 2y
[80] NCDB 1745 205328 40.6 17.3 21.9 14.8 56%* 33.1%* 5.7 6.2 13 13.8 2y
(0.8%)
[81] CA Cancer Reg 95 14746 4 NR
(0.6%)
Digits in italics indicate the study found a statistically significant difference in this measure. *Indicates measurement of percent tumors ≥ 4 cm. Poor diff: Poorly differentiated tumor on histology; OS: overall survival;
NR: not reported.
Table 3. Comparison of resected ASCP to PDAC
No. Of patients Poor diff (%) Node-positive (%) Tumor size (cm) Median OS (mo) OS (%)
Study Data source
ASCP PDAC ASCP PDAC ASCP PDAC ASCP PDAC ASCP PDAC ASCP PDAC Time
[78] single institution 91 3918 79.5 35.9 88 78 4.0 3.2 10.8 20.5 18.2 17.5 5y
(2.3%)
[79] SEER 176 17411 49.4 27.2 51.4 48.4 5.3 3.9 12 16 29 35.8 2y
(1.0%)
[80] NCDB 503 35492 57 33 55 61 53%* 30%* 14.8 22 18.2 19.2 5y
(1.4%)
[81] CA Cancer Reg 31 2071 57.7 60.2 4.6 3.3 12 NR
(1.5%)
Digits in italics indicate the study found a statistically significant difference in this measure. *Indicates measurement of percent tumors ≥ 4 cm. Poor diff: Poorly differentiated tumor on histology; OS: overall survival;
NR: not reported.
Clinical manifestations
ASCP patients have been reported to present with anorexia, weight loss, abdominal pain, nausea and vomiting, fever, and occasionally jaundice [90-96] . Jaundice
may be less prominent given that primary tumors in the head of the pancreas are less frequent than seen in PDAC, with a higher incidence of body and tail
tumors observed. While malignant hypercalcemia is almost never seen in PDAC, multiple cases of hypercalcemia due to elevated PTHrP (Parathyroid
hormone-related protein) have been reported in ASCP patients [97-99] . This is likely driven by the squamous component, given that malignant hypercalcemia is
not infrequently seen in other squamous solid tumors that arise from lung, esophagus, and head and neck .
[100]