
Page 27 - Read Online
P. 27
Page 6 of 16 Merhi et al. J Cancer Metastasis Treat 2021;7:42 https://dx.doi.org/10.20517/2394-4722.2021.80
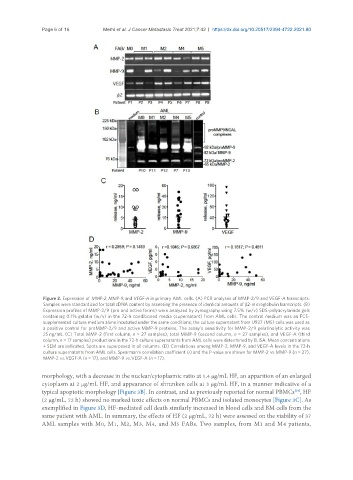
Figure 2. Expression of MMP-2, MMP-9, and VEGF-A in primary AML cells. (A) PCR analyses of MMP-2/9 and VEGF-A transcripts.
Samples were standardized for total cDNA content by assessing the presence of identical amounts of β2-microglobulin transcripts. (B)
Expression profiles of MMP-2/9 (pro and active forms) were analyzed by zymography using 7.5% (w/v) SDS-polyacrylamide gels
containing 0.1% gelatin (w/v) in the 72-h conditioned media (supernatant) from AML cells. The control medium was an FCS-
supplemented culture medium alone incubated under the same conditions; the culture supernatant from U937 (M5) cells was used as
a positive control for proMMP-2/9 and active MMP-9 proteins. The assay’s sensitivity for MMP-2/9 gelatinolytic activity was
25 ng/mL. (C) Total MMP-2 (first column, n = 27 samples), total MMP-9 (second column, n = 27 samples), and VEGF-A (third
column, n = 17 samples) productions in the 72-h culture supernatants from AML cells were determined by ELISA. Mean concentrations
± SEM are indicated. Spots are superposed in all columns. (D) Correlations among MMP-2, MMP-9, and VEGF-A levels in the 72-h
culture supernatants from AML cells. Spearman’s correlation coefficient (r) and the P-value are shown for MMP-2 vs. MMP-9 (n = 27),
MMP-2 vs. VEGF-A (n = 17), and MMP-9 vs. VEGF-A (n = 17).
morphology, with a decrease in the nuclear/cytoplasmic ratio at 1.4 μg/mL HF, an apparition of an enlarged
cytoplasm at 2 μg/mL HF, and appearance of shrunken cells at 3 μg/mL HF, in a manner indicative of a
[24]
typical apoptotic morphology [Figure 3B]. In contrast, and as previously reported for normal PBMCs , HF
(2 μg/mL, 72 h) showed no marked toxic effects on normal PBMCs and isolated monocytes [Figure 3C]. As
exemplified in Figure 3D, HF-mediated cell death similarly increased in blood cells and BM cells from the
same patient with AML. In summary, the effects of HF (2 μg/mL, 72 h) were assessed on the viability of 37
AML samples with M0, M1, M2, M3, M4, and M5 FABs. Two samples, from M1 and M4 patients,