
Page 17 - Read Online
P. 17
Page 12 of 21 Su et al. J Cancer Metastasis Treat 2020;6:19 I http://dx.doi.org/10.20517/2394-4722.2020.48
A B C D E
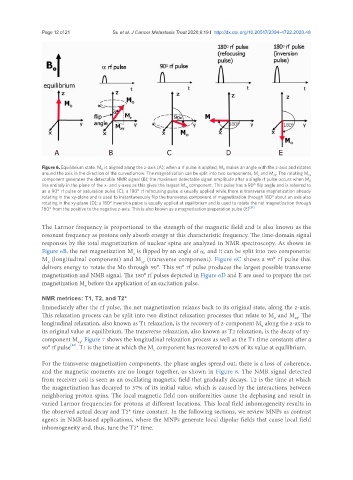
Figure 6. Equilibrium state. M 0 is aligned along the z-axis (A); when a rf pulse is applied, M 0 makes an angle with the z-axis and rotates
around the axis in the direction of the curved arrow. The magnetization can be split into two components, M z and M xy . The rotating M xy
component generates the detectable NMR signal (B); the maximum detectable signal amplitude after a single rf pulse occurs when M 0
lies entirely in the plane of the x- and y-axes as this gives the largest M xy component. This pulse has a 90° flip angle and is referred to
as a 90° rf pulse or saturation pulse (C); a 180° rf refocusing pulse is usually applied while there is transverse magnetization already
rotating in the xy-plane and is used to instantaneously flip the transverse component of magnetization through 180° about an axis also
rotating in the xy-plane (D); a 180° inversion pulse is usually applied at equilibrium and is used to rotate the net magnetization through
180° from the positive to the negative z-axis. This is also known as a magnetization preparation pulse (E) [81]
The Larmor frequency is proportional to the strength of the magnetic field and is also known as the
resonant frequency as protons only absorb energy at this characteristic frequency. The time-domain signal
responses by the total magnetization of nuclear spins are analyzed in NMR spectroscopy. As shown in
Figure 6B, the net magnetization M is flipped by an angle of α, and it can be split into two components:
0
M (longitudinal component) and M (transverse component). Figure 6C shows a 90° rf pulse that
xy
x
delivers energy to rotate the Mo through 90°. This 90° rf pulse produces the largest possible transverse
magnetization and NMR signal. The 180° rf pulses depicted in Figure 6D and E are used to prepare the net
magnetization M before the application of an excitation pulse.
0
NMR metrices: T1, T2, and T2*
Immediately after the rf pulse, the net magnetization relaxes back to its original state, along the z-axis.
This relaxation process can be split into two distinct relaxation processes that relate to M and M . The
xy
z
longitudinal relaxation, also known as T1 relaxation, is the recovery of z-component M along the z-axis to
x
its original value at equilibrium. The transverse relaxation, also known as T2 relaxation, is the decay of xy-
component M . Figure 7 shows the longitudinal relaxation process as well as the T1 time constants after a
xy
[82]
90° rf pulse . T1 is the time at which the M component has recovered to 63% of its value at equilibrium.
x
For the transverse magnetization components, the phase angles spread out, there is a loss of coherence,
and the magnetic moments are no longer together, as shown in Figure 8. The NMR signal detected
from receiver coil is seen as an oscillating magnetic field that gradually decays. T2 is the time at which
the magnetization has decayed to 37% of its initial value, which is caused by the interactions between
neighboring proton spins. The local magnetic field non-uniformities cause the dephasing and result in
varied Larmor frequencies for protons at different locations. This local field inhomogeneity results in
the observed actual decay and T2* time constant. In the following sections, we review MNPs as contrast
agents in NMR-based applications, where the MNPs generate local dipolar fields that cause local field
inhomogeneity and, thus, tune the T2* time.