
Page 40 - Read Online
P. 40
Page 6 of 16 Tu et al. J Cancer Metastasis Treat 2018;4:58 I http://dx.doi.org/10.20517/2394-4722.2018.67
A B
C
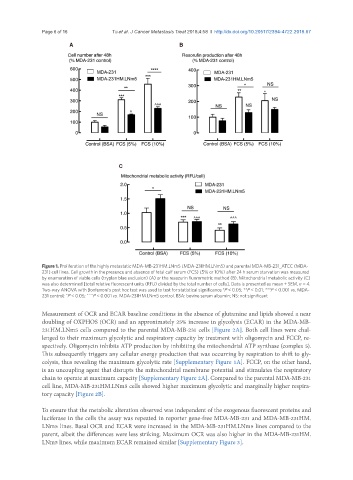
Figure 1. Proliferation of the highly metastatic MDA-MB-231HM.LNm5 (MDA-231HM.LNm5) and parental MDA-MB-231_ATCC (MDA-
231) cell lines. Cell growth in the presence and absence of fetal calf serum (FCS) (5% or 10%) after 24 h serum starvation was measured
by enumeration of viable cells (tryplan blue exclusion) (A) or the resazurin fluorometric method (B). Mitochondrial metabolic activity (C)
was also determined [total relative fluorescent units (RFU) divided by the total number of cells]. Data is presented as mean ± SEM, n = 4.
Two-way ANOVA with Bonferroni’s post hoc test was used to test for statistical significance *P < 0.05; **P < 0.01; ***P < 0.001 vs. MDA-
231 control; ^P < 0.05; ^^^P < 0.001 vs. MDA-231HM.LNm5 control. BSA: bovine serum albumin; NS: not significant
Measurement of OCR and ECAR baseline conditions in the absence of glutamine and lipids showed a near
doubling of OXPHOS (OCR) and an approximately 25% increase in glycolysis (ECAR) in the MDA-MB-
231HM.LNm5 cells compared to the parental MDA-MB-231 cells [Figure 2A]. Both cell lines were chal-
lenged to their maximum glycolytic and respiratory capacity by treatment with oligomycin and FCCP, re-
spectively. Oligomycin inhibits ATP production by inhibiting the mitochondrial ATP synthase (complex 5).
This subsequently triggers any cellular energy production that was occurring by respiration to shift to gly-
colysis, thus revealing the maximum glycolytic rate [Supplementary Figure 1A]. FCCP, on the other hand,
is an uncoupling agent that disrupts the mitochondrial membrane potential and stimulates the respiratory
chain to operate at maximum capacity [Supplementary Figure 2A]. Compared to the parental MDA-MB-231
cell line, MDA-MB-231HM.LNm5 cells showed higher maximum glycolytic and marginally higher respira-
tory capacity [Figure 2B].
To ensure that the metabolic alteration observed was independent of the exogenous fluorescent proteins and
luciferase in the cells the assay was repeated in reporter gene-free MDA-MB-231 and MDA-MB-231HM.
LNm5 lines. Basal OCR and ECAR were increased in the MDA-MB-231HM.LNm5 lines compared to the
parent, albeit the differences were less striking. Maximum OCR was also higher in the MDA-MB-231HM.
LNm5 lines, while maximum ECAR remained similar [Supplementary Figure 3].