
Page 179 - Read Online
P. 179
Page 10 of 14 Ansari et al. J Cancer Metastasis Treat 2019;5:20 I http://dx.doi.org/10.20517/2394-4722.2018.68
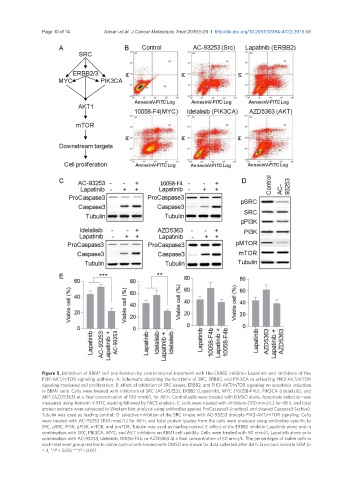
Figure 5. Inhibition of BBM1 cell proliferation by combinatorial treatment with the ERBB2 inhibitor Lapatinib and inhibitors of the
PI3K-AKT/mTOR signaling pathway. A: Schematic depicting the functions of SRC, ERBB2, and PIK3CA in activating PIK3-AKT/mTOR
signaling-mediated cell proliferation; B: effect of inhibition of SRC kinase, ERBB2, and PIK3-AKT/mTOR signaling on apoptosis induction
in BBM1 cells. Cells were treated with inhibitors of SRC (AC-93253), ERBB2 (Lapatinib), MYC (10058-F4b), PIK3CA (Idelalisib), and
AKT (AZD5363) at a final concentration of 100 nmol/L for 48 h. Control cells were treated with DMSO alone. Apoptosis induction was
measured using Annexin V-FITC staining followed by FACS analysis; C: cells were treated with inhibitors (100 nmol/L) for 48 h, and total
protein extracts were subjected to Western blot analysis using antibodies against ProCaspase3 (inactive) and cleaved Caspase3 (active).
Tubulin was used as loading control; D: selective inhibition of the SRC kinase with AC-93253 disrupts PIK3-AKT/mTOR signaling. Cells
were treated with AC-93253 (100 nmol/L) for 48 h, and total protein lysates from the cells were analyzed using antibodies specific to
SRC, pSRC, PI3K, pPI3K, mTOR, and pmTOR. Tubulin was used as loading control; E: effect of the ERBB2 inhibitor Lapatinib alone and in
combination with SRC, PIK3CA, MYC, and AKT inhibitors on BBM1 cell viability. Cells were treated with 50 nmol/L Lapatinib alone or in
combination with AC-93253, Idelalisib, 10058-F4b, or AZD5363 at a final concentration of 50 nmol/L. The percentages of viable cells in
each treatment group relative to viable control cells treated with DMSO are shown for data collected after 48 h. Error bars indicate SEM (n
= 3, **P < 0.05; ***P < 0.01)